Greenhouse Gas Emissions: Causes, Impacts, and Solutions for Climate Change

- Human activities have increased greenhouse gases, causing climate change and environmental harm.
- Methane and nitrous oxide are much more potent than carbon dioxide in trapping heat.
- The energy sector is the largest source of greenhouse gas emissions globally.
- Reducing emissions requires renewable energy, efficiency improvements, and carbon capture technologies.
At the core of today's most pressing environmental challenge lies a pivotal question: "Are greenhouse gases bad for the environment?" The answer, as scientific evidence overwhelmingly shows, is a resounding yes.
Greenhouse gases (GHGs) such as carbon dioxide (CO2), methane (CH4), nitrous oxide (N2O), and certain synthetic chemicals are essential components of the Earth's atmosphere. Some of the environment have become the architects of climate change, trapping heat in our atmosphere and setting off a cascade of global impacts.
Each GHG has a different ability to absorb heat in the atmosphere, known as its Global Warming Potential (GWP). For example, methane traps 34 times more heat than CO2 over a century, while nitrous oxide is 298 times more potent.
Though greenhouse gases are crucial for life on Earth, with them, the planet would be warmer for most forms of life. However, the balance of these gases is delicate.
Since the late 1700s, human activities such as burning fossil fuels, deforestation, and industrial processes have increased the concentration of GHGs, disrupting the natural radiative balance and contributing to climate change.
Although the primary GHG emissions vary by region, they generally include burning fossil fuels for electricity, heat, transportation, and emissions from agriculture.
Global Greenhouse Gas Emissions
| Greenhouse Gas | Concentration Increase Since 1750 (%) | GWP (100-year timescale) | Current Percentage of Emission |
|---|---|---|---|
| Carbon Dioxide (CO2) | 148% | 1 | 74.1% |
| Methane( CH4) | 259% | 34 | 17.3% |
| Nitrous Oxide (N2O) | 123% | 298 | 6.2 |
Therefore, this article will explore the profound effects on global temperatures, weather patterns, and ecosystems. We unravel the environmental consequences of these invisible yet potent forces.
What do we mean by greenhouse gas exactly?
Greenhouse gases (GHGs) are gases in Earth's atmosphere that trap heat, contributing to the greenhouse effect. Without these gases, Earth's average temperature would be about -18 °C (-0.4°F), rather than the current average of 14°C (57°F).
The primary greenhouse gases are water vapour, carbon dioxide (CO2), methane (CH4), nitrous oxide (N2O), and fluorinated gases (such as hydrofluorocarbons, perfluorocarbons, and sulfur hexafluoride). Each of these gases has a different ability to trap heat in the atmosphere, measured by their Global Warming Potential (GWP). GWP measures how much energy the emissions of 1 ton of a gas will absorb over a given period, typically 100 years, compared to 1 ton of CO2.
- Carbon dioxide (CO2) is the most significant anthropogenic greenhouse gas, released mainly through burning fossil fuels (coal, natural gas, and oil), deforestation, and various industrial processes.
- Methane (CH4) is emitted during the production and transport of coal, oil, and natural gas, as well as by livestock and other agricultural practices and by the decay of organic waste in municipal solid waste landfills.
- Nitrous oxide (N2O) is emitted from agricultural and industrial activities and during fossil fuels and solid waste combustion.
- Fluorinated gases are synthetic, potent greenhouse gases emitted from various industrial processes and are used as substitutes for ozone-depleting substances. They are in much smaller concentrations but are much more powerful than CO2.
The impact of the above gases on climate change depends on their abundance, how long they stay in the atmosphere, and how strongly they impact the atmosphere.
Environmental impact of greenhouse gases
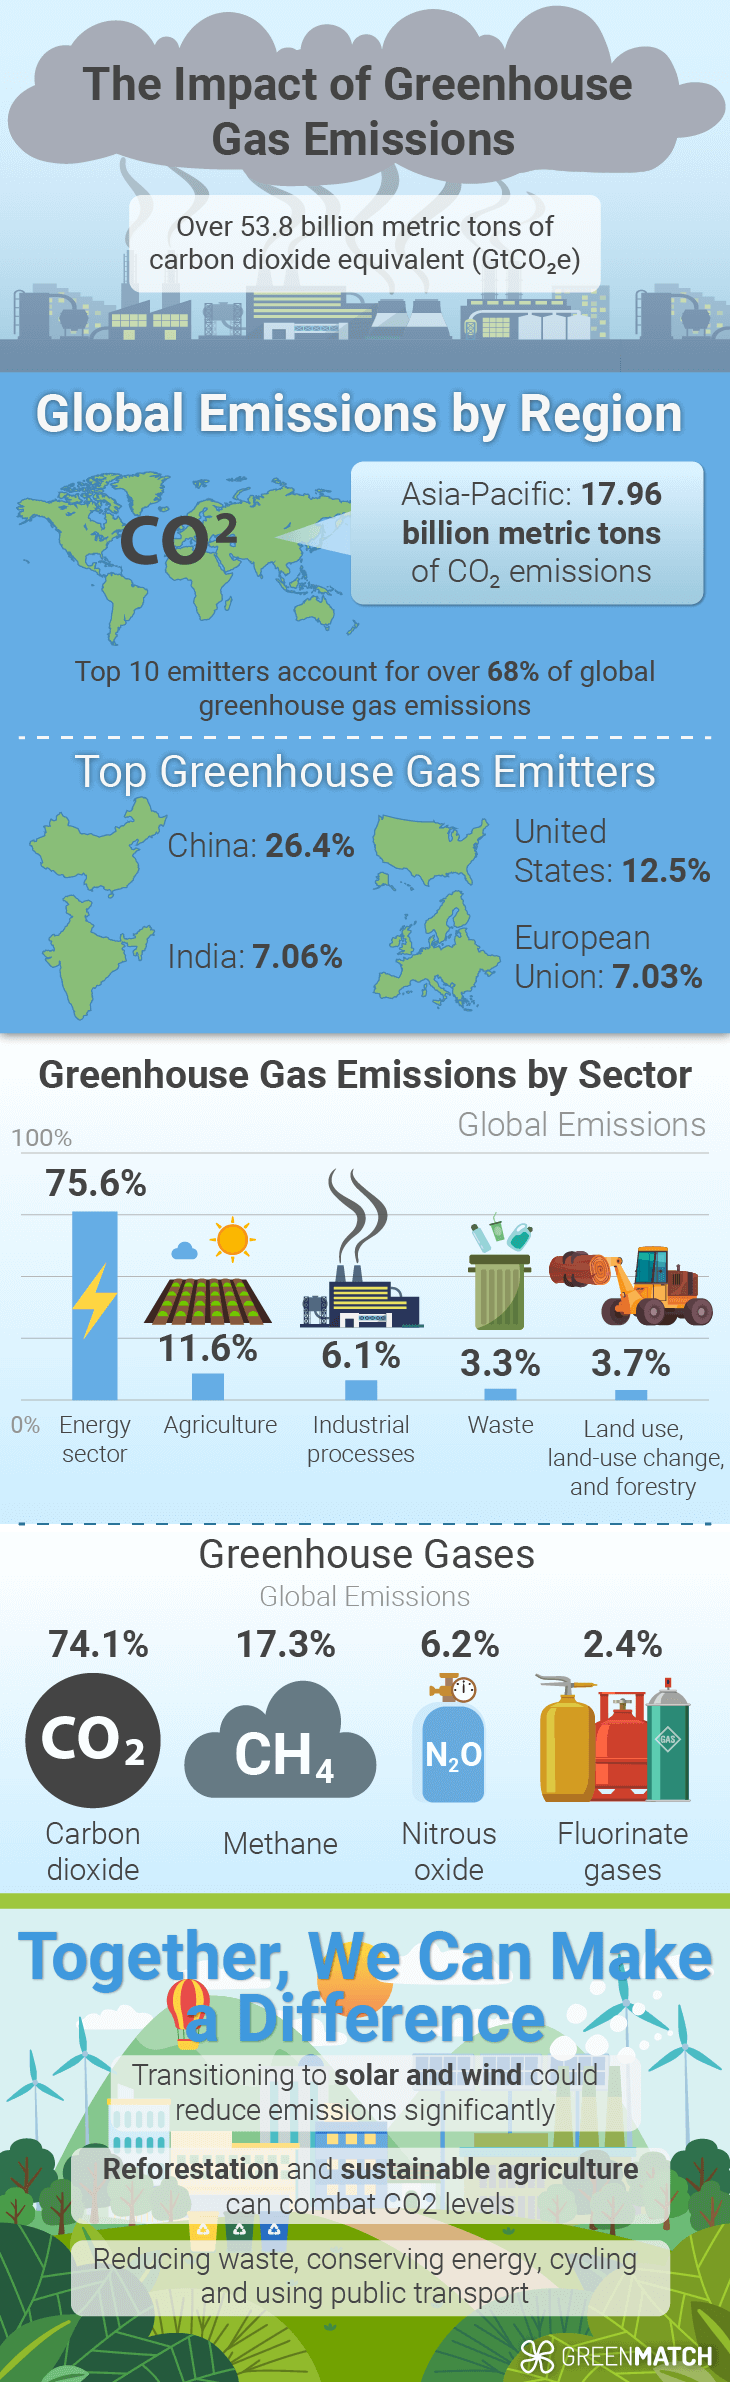
GHGs profoundly and multifacetedly impact the environment. In 2022, the Asia-Pacific region was the largest emitter of CO2, producing 17.96 billion metric tons, surpassing the combined emissions from other areas.
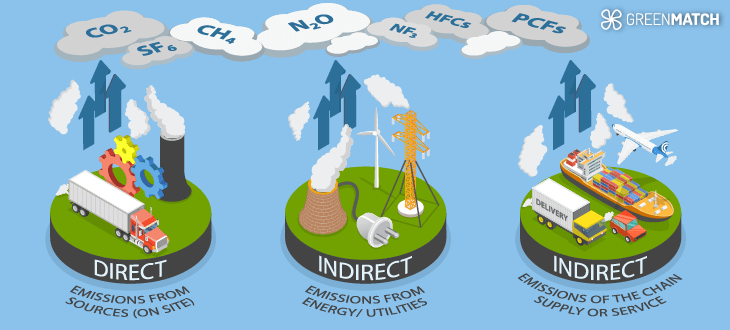
We categorise GHG emissions by electricity, industry, agriculture, and transportation sources.
The largest single source globally is burning fossil fuels for electricity and heat, accounting for 23% of 2010 global GHG emissions.
Emissions by sector
- Electricity and Heat Production: The primary source of CO2, with coal, natural gas, and oil combustion being significant contributors, accounting for 75.6% of global emissions.
- Industry: Accounts for 24% of global emissions, with fossil fuel combustion at facilities and emissions from chemical and metallurgical processes.
- Agriculture, Forestry, and Other Land Use: This represents 22% of emissions, mainly from agriculture and deforestation. Carbon sequestration activities partially offset this sector's emissions.
- Transportation: Contributes 15% to global emissions, predominantly from petroleum-based fuels used in vehicles.
- Buildings: Emissions arise from energy generation and burning fuels for heat, accounting for 6% of global emissions.
Emissions by continent and country
Historically, Europe and the United States have been the largest contributors to cumulative CO2 emissions. However, the share of South America, Asia, and Africa emissions has grown in recent decades. China and the United States are currently the top CO2 emitters by volume, with the U.S. having emitted more CO2 historically than any other country.
Below is the breakdown of emissions according to Our World in Data and World Population Review
- Asia: Led by China with emissions of 9,877 million metric tons, the continent is the largest emitter due to its sizeable population and rapid industrialisation.
- North America: The United States follows China with 4,745 million metric tons of GHGs, a significant portion coming from energy production and transportation.
- Europe: Russia and Germany are notable contributors, with emissions mainly from the energy sector.
- South America, Africa, and Oceania: These regions contribute less to global emissions but are still significant, especially in agriculture and deforestation.
| Region/Country | CO₂ Emissions (billion metric tons) | Per Capita CO₂ Emissions (tCO₂e) |
|---|---|---|
| Asia-Pacific | 18.9 | 5.1 |
| China | 4.74 (26.4% of global) | 9.06 |
| United States | 5.41 (12.5% of global) | 18.28 |
| India | 2.69 (9.3% of global) | 2.48 |
| European Union | 1.27 (7.03% of global) | 7.56 |
Top five countries
Based on the most recent data, the top five countries that produce the most emissions are:
| Rank | Country | CO2 Emissions (million metric tons) | Primary Energy Source |
|---|---|---|---|
| 1 | China | 15.7 | Coal |
| 2 | United States | 6 | Transportation |
| 3 | India | 3.9 | Industrialisation |
| 4 | Russia | 2.6 | Natural Gas |
| 5 | Japan | 1,602 | Oil |
Per capita emissions
Per capita emissions vary widely, with countries like the United States and Russia having much higher per capita emissions than the UK, France, or Ukraine.
While total emissions highlight the most significant contributors to global warming, per capita emissions offer insight into the carbon footprint of individual residents within a country. Here, we explore the top 10 countries with the highest per capita emissions based on recent data.
| Rank | Country | Per Capita GHG Emissions (t) |
|---|---|---|
| 1 | Qatar | 67.38 |
| 2 | Kuwait | 25.00 |
| 3 | United Arab Emirates | 21.80 |
| 4 | Brunei | 20.60 |
| 5 | Saudi Arabia | 18.90 |
What is so bad about greenhouse gases for the environment?
The negative impact of GHGs on the environment is primarily due to the enhanced greenhouse effect caused by the increased concentrations of these gases from human activities. For instance, CO2 concentrations have risen to 48% above pre-industrial levels due to human activities.
However, different GHGs have varying global warming potentials (GWPs). For example, methane (CH4) does not stay in the atmosphere as long as carbon dioxide (CO2) but absorbs much more sun energy, making it a more potent greenhouse gas over the short term. Fluorinated gases (F-gases), though emitted in smaller quantities, trap heat far more effectively than CO2.
What is the impact of greenhouse gases?
Total impact per year
In 2022, U.S. greenhouse gas emissions totalled 6,341.2 million metric tons of carbon dioxide equivalents, with a slight increase of 1% from the previous year, primarily due to increased CO2 emissions from fossil fuel combustion.
Globally, emissions continue to rise, with significant contributions from CO2, methane, and nitrous oxide. Methane, for example, has a global warming potential (GWP) 28 times greater than CO2 over 100 years, and its emissions are particularly concerning. For example, oil and gas operations and coal production represented another 10%, nearly 135 Mt CH4 or around 4 Gt CO2-eq.
Impact per day
Breaking down the annual figures, the daily global emission of GHGs averaged approximately 113 million tonnes of CO2-eq. Apart from this, every day, millions of tons of CO2 and other GHGs are emitted into the atmosphere, contributing to the gradual increase in global temperatures and the acceleration of climate change. These activities contribute to the release of approximately 137 million tonnes of greenhouse gases.
Impact per usage
The impact of GHGs can also be considered on a per-usage basis. For example, burning 1 gallon of gasoline releases about 8.89 kilograms of CO2. On a larger scale, the energy sector is the largest source of GHG emissions, primarily due to the combustion of fossil fuels for electricity, heat, and transportation.
To illustrate the impact of greenhouse gases, the following table provides a snapshot of global GHG emissions by type:
| Greenhouse Gas | Global Emissions (Billion Metric Tons CO2eq/year) | Global Warming Potential (over 100 years) |
|---|---|---|
| Carbon Dioxide (CO2) | 36.44 (approx.) | 1 |
| Methane (CH4) | 7.24 (approx.) | 28 |
| Nitrous Oxide (N2O) | 1.12 (approx.) | 265 |
| Fluorinated Gases | 0.18 (approx.) | Up to 23,500 |
Are greenhouse gases toxic?
While some greenhouse gases like CO2 and methane are not toxic in small concentrations and are part of natural processes, others, especially certain fluorinated gases, are potent and have a high global warming potential (GWP).
For example, sulfur hexafluoride is the most potent greenhouse gas listed, with a GWP of 22,800 times that of CO2 over 100 years, and it stays in the atmosphere for 3,200 years.
Moreover, producing certain chemicals, such as PFAS (per- and polyfluoroalkyl substances), involves the emission of potent greenhouse gases like HCFC-22, which is about 5,000 times more powerful than carbon dioxide. These "forever chemicals" release greenhouse gases and lead to environmental contamination.
| Greenhouse Gas | Global Warming Potential (GWP) | Atmospheric Lifespan | Percentage of Global Emissions |
|---|---|---|---|
| CO2 | 1 (reference) | Up to thousands of years | 75% |
| CH4 | 29.8 | ~12 years | 17% |
| N2O | 273 | >100 years | 6% |
| SF6 | 25,200 | 3,200 years | 3% |
Is it possible to get rid of greenhouse gas?
While challenging, removing greenhouse gases from the atmosphere is possible through natural and technological methods. The costs are significant but necessary investments to combat climate change and its devastating impacts.
How do you get rid of greenhouse gases?
There are several strategies for removing GHGs from the atmosphere. One of the most discussed methods is Direct Air Capture (DAC), which involves chemically scrubbing CO2 from the air and sequestering it underground.
Other natural approaches include reforestation and soil carbon sequestration, which leverage the natural ability of trees and soils to absorb CO2
Can we burn greenhouse gases?
Burning GHGs is not a viable solution. Combustion would release more CO2 into the atmosphere, exacerbating the problem. Instead, the focus is on capturing and storing these gases or converting them into less harmful substances.
What can be done with leftover greenhouse gases?
Once captured, CO2 can be used in various ways, such as producing carbon-neutral fuels, carbonated beverages, or enhanced oil recovery processes. However, the primary goal is to store it safely in geological formations to prevent its release into the atmosphere. That is, finding preventive methods or using them to reduce overall emissions.
Greenhouse Gas Removal (GGR) technologies
Removing CO2 and other GHGs from the atmosphere is necessary to achieve net-zero emissions. Several technologies and methods are being developed and deployed for this purpose:
- Direct Air Capture (DAC): Technologies like those developed by Carbon Engineering and Climeworks capture CO2 directly from the atmosphere for storage or use.
- Carbon Capture and Storage (CCS): This process captures CO2 emissions from industrial sources and power generation, transporting it to be stored underground in geological formations.
- Bioenergy with Carbon Capture and Storage (BECCS): Combining biomass energy production with CCS allows the removal of CO2 from the atmosphere while generating energy.
- Afforestation and reforestation: Planting new forests and managing existing ones absorb CO2 through photosynthesis.
- Soil carbon sequestration: Agricultural practices can be modified to increase the amount of carbon stored in soils
How much money would this cost us?
The cost of removing GHGs varies widely depending on the method. For example, enhancing natural carbon sinks like forests can be relatively inexpensive, generally costing less than £20 per ton of CO2.
In contrast, technological solutions like DAC are more costly, with estimates ranging significantly based on the scale and technology used. The International Monetary Fund (IMF) suggests that reducing GHG emissions can be compared to the social cost of carbon, estimated at £50 per ton of CO2.
However, the actual cost must consider long-term impacts, the potential for innovation, and the social cost of carbon, which has been estimated at around £38 per ton.
The financial investment required is substantial, but weighing these costs against the far-reaching economic damages climate change could cause is crucial.
| Method | Cost per ton (GBP) | Potential CO2 Removal (Gigatons/year) |
|---|---|---|
| Trees and Forests | < £20 | Variable, depending on the scale |
| Direct Air Capture | High, variable. This means chemical scrubbing of CO2 from the air | Up to 5-16 by 2050 |
| Soil Carbon Sequestration | Low to moderate. This means improved farming practices to increase soil carbon | Variable |
| Reducing Food Waste | Cost-saving | Significant methane reduction |
| Natural Gas Combined-Cycle Generation | Efficient natural gas power plants | £20 |
Challenges and considerations
While the potential of these technologies and methods is significant, there are challenges to their widespread adoption, including:
- Scalability: Many GGR technologies require significant development and demonstration to be deployed at the scale necessary to impact atmospheric GHG levels substantially.
- Cost: The economic viability of these technologies varies, with some currently being more expensive than traditional carbon reduction methods.
- Social acceptability: Public acceptance and regulatory frameworks are crucial for the large-scale deployment of GGR technologies.
- Resource competition: Some GGR methods, particularly those involving land use, may compete with other human activities, such as food production
Are greenhouse gases sustainable?
Greenhouse gases are not sustainable in climate change, as their increasing atmospheric concentrations are due to human activities. However, reducing greenhouse gas greenhouse gas emissions is crucial for sustainability, as demonstrated by Yale's reduction of net emissions by 28% since 2015 and the EU's efforts to reduce greenhouse gas emissions by 22% in 2021 compared to 2008 levels.
There has been a slowdown in GHG emissions growth, with a 0.1 per cent increase in the second quarter of 2023. However, adopting renewable energy sources, such as wind and solar power, should be considered sustainable because they produce little to no greenhouse gas emissions once operational.
What are the alternatives to greenhouse gas emissions?
Alternatives to greenhouse gas emissions focus on reducing the reliance on fossil fuels and implementing more sustainable practices across various sectors, including energy production, transportation, building, and industry. The primary strategies involve transitioning to renewable energy sources, improving energy efficiency, adopting low-emission transportation options, and enhancing carbon capture technologies.
Below is a detailed overview of these alternatives:
Renewable energy
Renewable energy sources such as solar, wind, geothermal, and hydroelectric power offer significant potential to reduce greenhouse gas emissions. These technologies generate electricity with little to no carbon emissions, making them crucial for replacing fossil fuel-based power generation.
Energy efficiency
Improving energy efficiency in buildings, vehicles, and industrial processes can significantly reduce energy demand and associated emissions. This includes adopting more efficient appliances, enhancing building insulation, and implementing industry energy management systems.
For example, transitioning to LED lighting and optimising heating and cooling systems can lower energy consumption and reduce emissions.
Low-emission transportation
Transitioning to low-emission vehicles, such as electric cars, hybrids, and those powered by alternative fuels like biodiesel and compressed natural gas, can substantially decrease emissions from the transportation sector. Encouraging the use of public transportation, cycling, and walking, as well as investing in infrastructure to support these modes of transport, also plays a critical role.
Carbon Capture and Storage (CCS)
CCS technology captures carbon dioxide emissions from power plants and industrial facilities and stores them underground to prevent them from entering the atmosphere. This technology can capture up to 90% of carbon emissions from a facility, offering a way to reduce emissions from sectors where alternatives are less viable.
Statistics, facts, and figures about greenhouse gas
Understanding GHG emissions' sources, impacts, and trends is crucial for developing strategies to mitigate environmental damage. According to Statista, ONS, IEA, WRI, EPA and other environmental sources, these statistics and trends of greenhouse gas emissions underscore the urgent need for global action to mitigate climate change.
Carbon Dioxide (CO2) is the largest contributor, accounting for 74.1% of global GHG emissions, primarily from fossil fuel combustion, deforestation, and land use change.
Methane (CH4) accounts for about 17.3% of all greenhouse gas emissions, with nitrous oxide (N2O) making up about 6%
Non-CO2 GHG emissions have increased significantly since 1900.
The UK emitted 512 million tonnes of carbon dioxide equivalent (Mt CO2e) in 2022, 7% below the pre-coronavirus pandemic of 550 Mt CO2e in 2019.
In 2022, 190 tonnes of CO2e were emitted per million pounds of UK economic activity (gross value added) on a residence basis, down 67%.
Global emissions from fuel combustion are dominated by coal (44%), followed by oil (32%) and natural gas (22%).
The top CO2 emitters were China, the United States, the European Union, India, the Russian Federation, and Japan.
Energy accounts for 75.6% of total greenhouse gas emissions globally.
FAQ about greenhouse gas emission
We strive to connect our customers with the right product and supplier. Would you like to be part of GreenMatch?
