40 Ways to Be More Eco Friendly in 2026

What It Means to Be Environmentally Friendly
Being eco friendly means living in a way that is not harmful to the environment. This way of life is becoming increasingly important, as we must protect our planet from man-made damage. There are various ways an individual can make sustainable changes to lessen the negative effects our daily lives usually contribute to.
It is possible to be eco friendly in different areas of our lives.
The Intergovernmental Panel on Climate Change continues to issue severe warnings of the failure of governments and systems to suitably react to the rapidly changing climate, which continues to rip through the poorest areas of the world, displacing more than 20 million people each year and intensifying global supply-demand dynamics.
The seismic shift required to circumvent further worsening of the effects of climate change will require action from individuals on a community level. This could include energy-based home improvements or reducing over-consumption. Currently, emissions from consumption in high-income cities are set to double by 2050. This must be urgently reduced by two-thirds by 2030 to ensure the health and happiness of future generations.
This extensive list spans 7 areas of your life where you can change your routines and reconsider your engagement with the systems around you. From small energy efficiency measures to energy system upgrades, from realising your purchasing power to adopting eco tourism habits. Making a start and having an awareness of personal changes that you can make can contribute towards system change and improve your local community.


If a whole 40 tips seems like a lot to take in, then here's a short list of 7 simple tips that cover each of the main areas we focus on throughout this article.
7 Ways to be More Eco Friendly
- Use LED lighting throughout your home.
- Use more public transport.
- Wash your clothes less often.
- Eat less meat.
- Limit plane travel.
- Change pension supplier.
- Invest in electronic devices instead of paper.
Keep reading to learn more about applying these changes to your everyday life and to get more actionable tips to apply to these areas.
Home Improvements

While homes may not pollute as much as corporations do, there are many things you as a homeowner can do to make your home a more eco friendly house. It is important to make a change wherever possible, and your home is something you have control over - so why not make the change? Here is a list of things you can do, from home improvements that require significant up-front capital to small, easy changes that can have a big impact.
1. Renewable Energy for Electricity
Solar photovoltaic (PV) installations convert the sun's energy into electricity using photovoltaic cells or solar panels. This allows you to generate your own reliable, sustainable and low-maintenance source of energy. This way, the best solar panels could save the average UK household one tonne of carbon per year, according to the Energy Saving Trust.
Once installed, they don’t release any emissions into their lives, and they don’t produce any noise or air pollution. This can greatly improve local air quality, which has respiratory health benefits.
Solar PV can also be combined with electric heating systems, such as air source heat pumps, to run your heating and hot water entirely from renewable sources.
Installing solar battery storage to accompany your solar PV system allows you to store energy and use it anytime during power outages. This gives you complete independence from the oil and gas-fuelled power grid.
Many solar panel grants in the UK can bring down the solar panel costs in the UK and make for relatively cheap solar panels.
2. Smart Thermostats
A smart thermostat is a home efficiency solution that is more easily implemented in the short term. These wifi-enabled features can be remote-controlled from any smart device. They can be connected to your central heating, boilers, and air conditioning systems.
This ever-evolving technology remembers your home’s heating patterns and knows when to heat or cool down your home based on outside temperatures. They use presence-sensing technology that automatically switches off your system when you leave the house and fires it up in time for you to come home.
This is useful in reducing energy demand from fossil-fuelled power plants, which has great cost benefits for your energy bills. Data collected from customers using Google’s Nest thermostat revealed that UK homes saved on energy use by 16.5% compared to homes without smart controls.
3. Energy Efficient Lighting
Energy-saving light bulbs last up to 12 times as much as traditional bulbs, providing the same light quality for much less energy. 80% of the energy used to power traditional bulbs is lost in heating energy, whereas LED light bulbs run at 80-90% energy efficiency.
According to the Energy Saving Trust, they can reduce carbon emissions by up to 40kg annually.
4. Upgrade to Energy Efficient Appliances
Every year, the UK produces 1.5 million tonnes of electrical waste. However, new regulations from the UK government mean that fixing faulty appliances is much easier because suppliers must now offer spare parts for products.
Once it’s time to replace your washing machine, fridge, freezer, oven or dishwasher, new efficiency measures have upgraded market standards so that energy-saving appliances are readily available for various prices. You can identify its energy efficiency by checking the energy efficiency label, which runs from A, with A being the most energy-efficient.
5. Use Eco-Cleaning Products
Many mainstream cleaning products containing detergents, preservatives, or foaming agents are made from various toxic chemicals that wash up into streams and rivers, causing water pollution that enters ecosystems and damages biodiversity.
Switching to products that contain sustainably grown or raised ingredients and non-synthetics reduces the risk of exposure to toxic chemicals harmful to humans and the environment.
You can also easily make your natural cleaners by mixing vinegar, lemon juice and bicarbonate of soda. This sustainable and cheaper alternative reduces toxic chemicals and packaging waste in your home.
6. Biodegradable Household Products
While you cannot control whether or not the products you dispose of will end up being recycled and reused, you can purchase products made of non-synthetic ingredients that are biodegradable to limit the impact of this waste.
Biodegradable products dissolve due to contact with bacteria and fungi. This means that if they come into contact with nature, they won’t cause any environmental harm, as they disappear through natural processes.

These products might include:
- Recycled toilet paper
- Natural ingredient shampoo
- Natural deodorant
- Bamboo toothbrush
- Washcloths made from hemp or agave fibres
Insulation and Draught Proofing
40% of the heating energy produced in your home is lost through gaps in windows, doors and floor. There are several ways to fill these to save energy and keep the heat in!
7. Double or Triple Glazed Windows
Double-glazed windows have two sheets of glass panels with a gap, and triple-glazed windows have three sheets with two gaps. The gaps keep air or gas (usually argon gas) vacuum-sealed. The gas prevents heat loss since it is a poor thermal conductor, so heat cannot easily pass through it.
Low-E glass is most effective for preventing heat loss as it has an invisible layer of metal oxide on one internal layer reflecting heat directly inside.
As well as keeping your home warm, upgrading your windows reduces outside noises travelling into your house and increases security. New windows cost can be low with the help of grants.
8. Cavity Wall Insulation

In older buildings with cavity walls, an inner and outer wall with an air gap in between, it’s a good idea to fit some insulation to optimise your home, especially if you're considering investing in a heat pump. Insulation comes in various types and materials, including wood fibre and polystyrene.
Insulation boards are best suited to large areas and cavity walls. For keen DIY-ers, this type of insulation is fairly easy to cut and fit yourself.
9. Loft Insulation
Simple Energy Advice says up to 25% of your home's heating energy is lost in the roof. With loft insulation, you can stop rising heat from escaping through your loft by laying down blanket loft insulation rolls that you can alter to fit between the joists in your loft.
10. Filling Gaps Between Your Floorboards
Gaps between older floorboards are inevitable as the wood expands and contracts due to varying air humidity levels. This causes avoidable draughts, which waste your home's heating energy.
You can fill these to exclude draughts using dust, resin or acrylic fillers, or wood filler strips, which you can find in most DIY stores.
11. Radiator Foil
Radiator foil is a thin sheet that reduces heat loss into external walls by reflecting heat into the room. This is a quick, simple and cheap alternative to wall insulation.
12. Draught Excluders
These can be adhered around window and door frames using foam, metal or plastic strips. You can also stop draughts coming in through your letterbox and keyhole. These excluders are usually cheap, easily installed and can be found in most DIY stores or online.
13. Window Seal Replacement
You should replace your window seals every 5-10 years since they expand and contract with the changing temperature over time and lose their air-tight grip.
Resealing your windows prevents heat loss from draughts and prevents moisture from building up, which can eventually lead to mould and further structural damage to the area around your windows.
Switch Heating Source
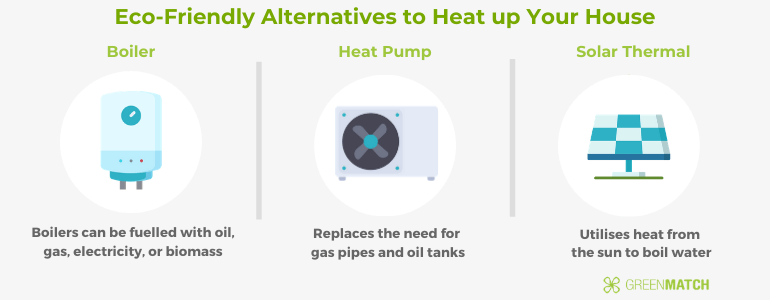
14. Upgrade Your Boiler
Modern boilers are now rated between A efficiency ratings. They must use condensing technology, which is 25% more energy-efficient than non-condensing boilers since it uses waste heat to preheat cold water.
Gas-fired boilers, like combi boilers, can provide heat on demand straight from the main lines, so energy is not wasted from storing heat.
Hydrogen boilers work the same way as usual modern boilers but burn hydrogen instead of natural gas. This new energy source is also emissions-free, with the only by-product from combustion being water. Some manufacturers have also released ‘hydrogen ready’ boilers that run on hydrogen fuel should it be brought to market.
Biomass boilers use biological material, or biomass, to produce heat through combustion. Biomass can also be converted to produce sustainable fuels such as biodiesel.
Despite expensive upfront costs, biomass boiler running costs are less vulnerable to market spikes than gas/oil-fired counterparts. They also fall under some government grants, including the ECO4 Scheme, which helps cover the installation costs.
15. Have Your Boiler Serviced
It’s very important to check your boiler annually to ensure it runs safely and efficiently. Your boiler might burn more fuel to heat your home, especially as it ages. This will cause your bills to rise and your energy consumption to increase. A licensed engineer will identify the problematic components and optimise your system for longer.
16. Heat Pumps

Heat pumps offer a sustainable alternative to boilers and air conditioners. They extract heat from the air, ground, or water and transfer it into your home. They extract heat from inside your home and send it outdoors to cool your home in the summer.
Heat pumps eliminate the need for gas pipes and oil tanks. 4kW of thermal energy is generated for every kW of electricity a heat pump uses, resulting in a 200-600% efficiency rate and significantly reducing your home's carbon emissions compared to gas or electric heating.
The UK Government Boiler Upgrade Scheme offers £5,000 off your air source heat pump costs.
17. Solar Thermal
Solar thermal systems use heat from the sun to provide space and water heating, or high-temperature collector solar thermal systems can also be used to generate electricity. They can be combined with your usual heating and hot water system to diversify your supply and utilise the sun's energy optimally throughout the year.
This will reduce your carbon emissions and hot water costs, saving at least £50 on energy bills, depending on what type of heating source you switch from.
How We Get Around
18. Electric Cars
Diesel- and petrol-fuelled cars are major contributors to global warming, mainly due to the amount of CO2 emissions they emit. 27% of the UK’s total emissions came from transport in 2019, with 91% from road transport vehicles.
Electric vehicles are the most sustainable driving method since they don’t use traditional fuels. They don’t produce any air pollutants from gas, particulates, or air toxics.
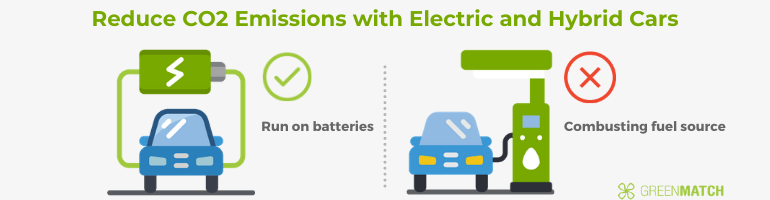
On the other hand, hybrid cars use traditional combustion fuels and an electric motor powered by a battery. Plug-in hybrids run primarily on an electric battery until the power runs out and the gasoline-powered engine takes over.
What We Wear

19. Wash Your Clothes Less
Synthetic material sheds microplastics in the washing machine, which reach the ocean. The ocean floor holds over 14 million tonnes of microplastics. This number is increasing, with textiles contributing 500,000 tonnes yearly. 16% of the microplastics released into the oceans come from washing these synthetic clothes. The toxic fibres degrade ecosystems and are ingested by sea life and, eventually, mammals, including humans.
Overwashing your clothes at high temperatures will also affect their quality over time. It’s also a great waste of water and energy from your washing machine. Also, be sure only to buy non-toxic detergents and avoid the use/overuse of tumble dryers.
20. Don’t Throw Wearable Clothes Away
The UK produces around 1 million tonnes of textile waste per year. Once in a landfill, they can take hundreds of years to decompose and release greenhouse gases (GHG).
Ultra-fast fashion, a mutation of fast fashion, has emerged as online clothing stores produce and release thousands of new items daily. Participating in these rapid trend cycles is creating a culture of over-consumerism.
You can make easy alterations and repairs to your clothing to keep them longer or adjust to current trends. Vintage and second-hand outlets will offer more affordable alternative options, often based on the same clothing items.
If you want some new clothing, be sure it’s of good quality and lasts a long time. You can also research sustainable brands that limit the impact of production and are transparent about their supply chains.
What We Eat

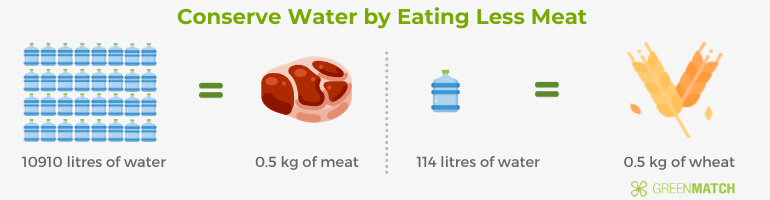
21. Eat Less Meat
Meat and dairy are responsible for most GHG emissions in the agriculture industry.
Emissions occur from the production stage to processing, packaging, and finally being delivered. Farming releases two powerful greenhouse gases: methane from livestock during digestion and nitrous oxide, an indirect product of organic and mineral nitrogen fertilisers.
As most emissions result from producing and preparing meat and dairy, consuming less meat would reduce GHG emissions. While some opt to drastically change their diets to a vegan one drastically, simply reducing your intake of meat can already have a big impact.
22. Shop for Local Produce
The average item of fresh food travels 1,500 miles before we buy it. These carbon-heavy value chains create emissions through transport, refrigeration and production processes.
You can eliminate this by buying from local producers where you can. A well-established local food economy strengthens supply chains, meaning there are more supply options during shortages. Local, seasonal produce also has higher nutritional value since it has spent less time from its source. Meanwhile, international produce is grown to artificially exceed its natural shelf life, which compromises its nutritional value.
23. Limit Food Waste
The UK produced 9.5 million tonnes of food waste in 2018, the equivalent of 25 million tonnes of greenhouse gas emissions. 70% of this was found to come from households. This raises emissions through increased industrial production and transportation.
You can limit your household food waste by portioning your meals reasonably, only buying what you need and using food waste as fertiliser for soil and plants.
How We Travel

24. Limit Plane Travel
Emissions from aviation could take up one-sixth of the carbon budget remaining to limit 1.5 degrees of global warming. Within the aviation industry, options for rapid decarbonisation are slow and limited. Therefore, personally limiting flights is the best way to reduce emissions. This is until sustainable aviation has become a viable, mainstream alternative.
Train travel is becoming more pleasant and economical, with new expanding train networks developing across Europe.
25. Avoid Cruise Holidays
Cruise holidays have become increasingly popular. However, these big ships contribute massively to GHG emissions. Carnival Corporation's fleet of 47 cruise ships emits 10 times more sulphur oxides (SOx) than 100 million cars.
It is important to be aware of your holiday's footprint on the environment and opt for more sustainable holidays when possible.

26. Practice Sustainable Tourism
Following the pandemic, people have become more aware of their cultural, economic and environmental impacts as tourists, with 72% of people surveyed by Booking.com admitting that they think sustainable travel is vital.
Increasingly, people are engaging more in sustainable tourism, which involves limiting their carbon footprint while travelling, being tactical with their spending power and helping sustain the natural environment they have the privilege to visit.
This helps prevent over-tourism, which is the overcrowding of tourist destinations that disrupts the local way of life through the rise in housing and renting costs and the commodification of local traditions.
Pollution, especially through excess waste, leads to the degradation of natural or archaeological sites and the depletion of natural resources, including water, soil nutrients and biodiversity.
Below are just some eco-tourism tips to consider for your next trip:

- Choose tour operators that invest in the local communities where they conduct their business
- Travel off-season
- Choose less tourist-heavy locations
- Don’t litter
- Use public transport as much as possible
- Stick to footpaths
- Use reusable containers and bottles rather than disposable paper plates, cutlery and cups
- Limit your energy use in accommodation such as by taking shorter showers, reducing air-conditioning use
- Spend in local shops and restaurants
- Use Environmentally Friendly Travel Products
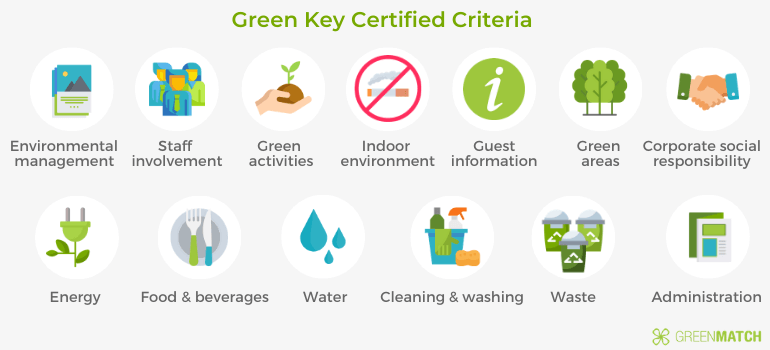
27. Green Key Certified Accommodation
Looking for the most sustainable places in their business is important when looking for accommodation abroad. Selecting Green Key-certified accommodation is one way to do that.
To be Green Key certified, 13 criteria need to be fulfilled. Being Green Key certified means that the accommodation respects local cultures and traditions, takes care of the environment and treats its employees fairly.
28. Unplug Before Travelling
Even if electronic devices are shut off or in sleep mode, they still use energy. Being away for too long wastes energy that could otherwise have been plugged off. So, before going on vacation, unplug your devices from the wall sockets to save electricity.
Each UK household spends around £50 – £86 a year to power appliances left in standby mode or unused.
29. Pack Light
Flying to foreign destinations will emit emissions no matter what. However, if flying is the only option, then travellers can try to pack light to minimise pollution. The more luggage a plane carries on its travels, the more fuel the aeroplane needs to fly.
30. Give Away Perishable Food Items before Travelling
Before leaving for vacation, check if any food item in the fridge is about to expire. If possible, consume it before the expiry date; otherwise, donate it to needy people and avoid food wastage.
At Work

Being conscious of the environment does not have to be limited to the home. There are many different things that employees can do to minimise environmental damage and make activities at their workplace more sustainable.
31. Change Pension Supplier
Pension funds represent the largest group of investors in the UK, holding around 2 trillion pounds in assets. By 2021, an estimated £128 billion was invested in fossil fuels from UK pension funds, nearly £2,000 for every person in the UK, Friends of the Earth found.
A mass switch from fossil-invested pension suppliers across the UK would reduce 19 tonnes of GHG emissions per year. Investigating your pension supplier and making a switch should you discover their investments in fossil fuels puts increased pressure on suppliers to diversify and decarbonise their investments.
32. Be Mindful of Printing Paper
A lot of paper is printed in an office space. It’s unavoidable that paper will be printed, whether it’s for a meeting or to sign a contract. However, printing out a document may not be entirely necessary.
The best thing you could do is to think if it is required to have a document in hard copy. If not, you could consider sending it via email. To minimise their carbon footprint, contracts can be sent and signed digitally.
33. Encourage Public Transportation for Employees
Depending on the distance from the employee’s home to the workplace, there are different ways to commute to work. While using a car may seem the easiest and fastest option, taking the train or bus would pollute less. You could ride a bicycle to work depending on your city's biking infrastructure.

34. Use Electricity Wisely
Offices naturally require electricity to power their equipment, amenities, and facilities. However, knowing about energy consumption and what is required is important.
Companies could contribute to a greener office by ensuring that electric devices are plugged off when not in use. It's good to stay aware of energy consumption and to make changes when the usage is predicted to go above the limit set for the month.
Moreover, an increasing number of large tech corporations are using green energy to meet their electricity needs.
35. Encourage the Mantra ‘Reduce, Reuse, Recycle’
These three well-known waste management principles will make your office more eco friendly. Offices should set up different containers for different types of products. Use recycling bins for paper, plastic, and soft drink cans rather than throwing everything out in one bin.

36. Use Recyclable Food Containers to Minimise Waste
When serving food at the office cafeteria, offer employees recyclable food containers so that they can take any leftover food home. This will greatly reduce food waste, a big issue in the UK.
At School

There are a lot of things that parents can do to ensure that their kids are more environmentally friendly at school. Whether it’s walking your kid to school or ensuring that they use environmentally friendly school supplies to minimise the damage done to nature. Inspiring kids to contribute to a greener environment and world is something we could and should do.
37. Make Green Choices to Go to School
As driving emits pollution, parents should consider alternative ways of getting their children to school, whether walking them to school or using public transportation. Using the car less can make a huge difference to the environment in the long run. In some cities like Copenhagen and Amsterdam, parents use cargo bikes to ride their children to school, which is a great eco friendly solution to using a car.
38. Donate Clothes
As children grow older, their school uniforms will undoubtedly have to be changed. Instead of throwing the clothes out, parents should consider donating the clothes back to the school or to other parents who are in need.
39. Use Containers, Not Paper Bags

When making lunch for children to bring to school, parents should invest in reusable lunch boxes instead of giving them food in paper bags to be thrown out. If a food item needs to be wrapped, avoid cling wrap and opt for more environmentally friendly wrapping materials like beeswax.
40. Invest in Electronic Devices Instead of Paper
As technology adapts to different scenarios, many different products can be used to take notes. Although investing in a laptop or a tablet may be expensive, your child could save time taking notes and help reduce paper waste at school.
Watch this video for some more eco-friendly tips:


We strive to connect our customers with the right product and supplier. Would you like to be part of GreenMatch?
