Mapped: Europe’s Most and Least Polluted Countries
The World Health Organization recently published a report saying that more than 90% of the world’s children are breathing in toxic air. Unfortunately, the world is polluted in more ways than one. With the increasing urgency of climate change and achieving Net Zero, it is important to understand the levels of pollution per country. Europe has the largest and wealthiest economy in the world. Nevertheless, there is a great diversity of pollution across the continent.
To give insight into the pollution level in different countries in Europe, GreenMatch conducted a comprehensive study shining light on the 7 factors that affect pollution:
- Carbon dioxide emissions from fuel combustion
- Concentrations of PM2.5 in urban areas
- Deaths attributable to air pollution
- Quality of designated drinking water sources
- Amount of waste
- Forest area
- Terrestrial and marine protected area
Click here to read more about the metrics.
The elements used to present the results are:
Interactive Map
The Most Polluted Countries
According to GreenMatch’s findings, Turkey is the most polluted, and Sweden is the cleanest European country.
1. Turkey

Turkey is the most polluted country in Europe with an overall score of 6.1/10. There are several arguments that resulted in this conclusion. As for the air in Turkey, the carbon dioxide pollution is 4.33 tonnes per capita per year, and the concentrations of PM2.5 are 41 µg/m3. In relation to this, there are 44 deaths attributable to air pollution per 100,000 capita per year. To compensate for the pollution, Turkey consists of only 15.2% forest area and has just 0.2% protected terrestrial or marine area. Turkey discards 424.625 kg of waste per capita each year.
2. Poland
Poland takes second place with an overall score of 5.5/10. The carbon dioxide emissions in poland are 7.63 tonnes per capita per year, which is higher than the winner Turkey. The concentrations of PM2.5 are 22 µg/m3 which is almost half of Turkey’s concentrations. There are 69 deaths attributable to air pollution per 100,000 capita per year. Poland consists of 30.8% forest area and 38.10% protected terrestrial and marine area. Each year, the citizens of Poland discard 304.9 kg of waste per capita.
3. Latvia

Latvia scores a close 5.4/10 behind Poland. Carbon dioxide emissions are 3.47 tonnes per capita per year, which is the lowest amount of all the countries in this study. Next to that, concentrations of PM2.5 are 14 µg/m3 in relation to the highest number of deaths attributable to air pollution of 91 per 100,000 capita per year. The waste discarded each year is 407.2 kg per capita.
The Cleanest Countries
1. Sweden

The least polluted country is Sweden with overall score of 2.8/10. The amount of carbon dioxide is 3.83 tonnes per capita per year, and the concentrations of PM2.5 are 6 µg/m3. The deaths attributable to air pollution consist of 0.4 per 100,000 capita per year. Next to that the country consists of 68.9% forest area and 15% protected terrestrial or marine area. Sweden discards 446.505 kg of waste per capita. Even though, this amount is higher than the amount of waste in Turkey, Sweden is doing much better on all the other metrics.
2. Finland and France

Finland shares second place with France with a score of 3.5/10.
Finland’s carbon dioxide emissions are 8.28 tonnes per capita per year. The PM2.5 concentrations are 7 µg/m3 per year in relation to 6 deaths per 100,000 capita per year. Finland consists of 73.1% forest area and 14.2% protected terrestrial and marine area. The waste discarded each year amounts to 502.974 kg per capita.
For France, carbon dioxide emissions are 4.38 tonnes per capita per year.

The concentrations of PM2.5 are 12 µg/m3 per year next to an amount of 17 deaths per 100,000 capita per year attributable to air pollution. France consists of 31% forest area and 33.2% protected terrestrial and marine area. The amount of waste discarded each year is 512.498 kg per capita.
Provided that France is one of the leading countries in terms renewable energy solutions, like solar panel installations and air source heat pumps, it should come as no surprise that they are ranking in the top of our list.
The UK vs. Europe
The UK takes a middle standpoint with and overall score of 4.3/10, which is 0.25 better than the European average. The comparison within the particular metrics is presented in the table below:
| Metric | UK's Result | Europe's Average |
|---|---|---|
| Carbon dioxide emissions from fuel combustion (tCO2/capita/year) | 5.65 | 6.70 |
| Annual mean concentration of PM2.5 in urban areas (ug/m3) | 11.00 | 13.36 |
| Deaths attributable to air pollution, per 100,000 capita per year (crude rate) | 26.00 | 35.00 |
| Waste (kg/capita/year) | 481.59 | 500.90 |
| Forest area (% of total land) | 13.00 | 34.40 |
| Forest and marine protected area (% of total land) | 28.80 | 22.01 |
Additionally, here's a green region checker tool that you can use if you want to find out how green is your region in the UK.
Read more: World's Greenest Countries
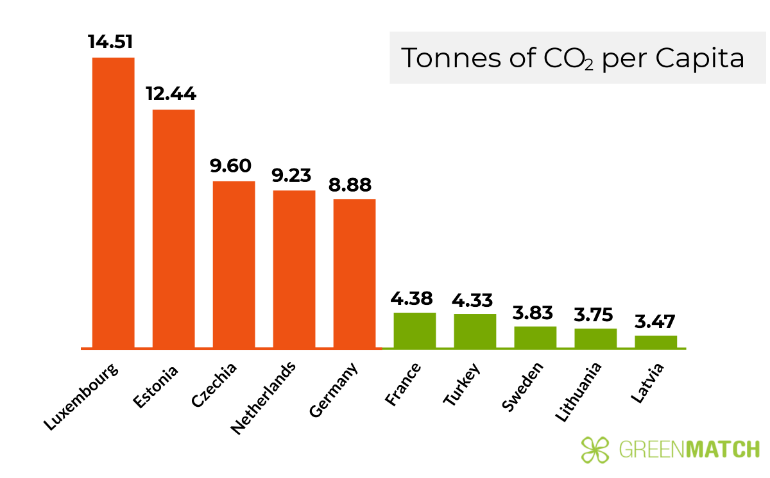
The Top 5 Most and Least Polluted Countries per Metric
The overall results show that Turkey performs the worst and Sweden performs the best. Yet, each country performs differently per metric.
CO2 emissions are the highest for Luxembourg with 14.51 tonnes per capita and the lowest for Latvia with a 3.47 tonnes per capita.
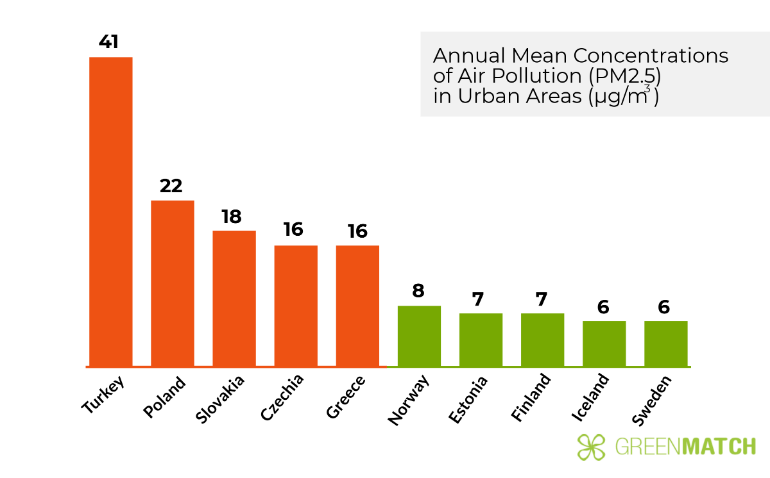
Turkey ranks the highest for air pollution with a 41 μg/m3 where Sweden has the lowest value of 6 μg/m3. The World Health Organization guideline limits the annual mean of PM2.5 concentrations at 10 μg/m3.
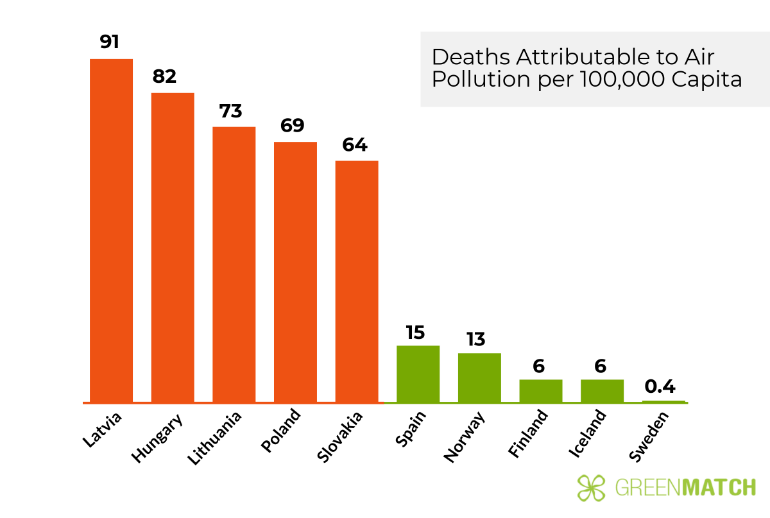
Latvia has the highest death rate attributable to air pollution with a 91 per 100,000 capita while Sweden has a death rate of 0.4 per 100,000 capita.
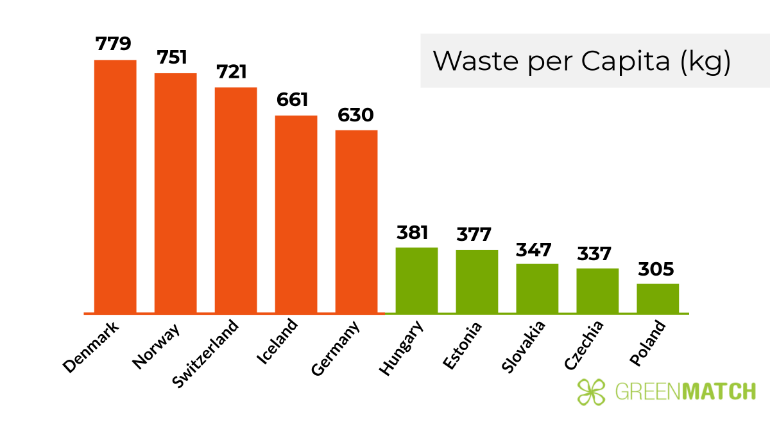
Denmark discards the most waste with an amount of 779 kg per capita per year where Poland discards less than half with an amount of 305 kg per capita each year.
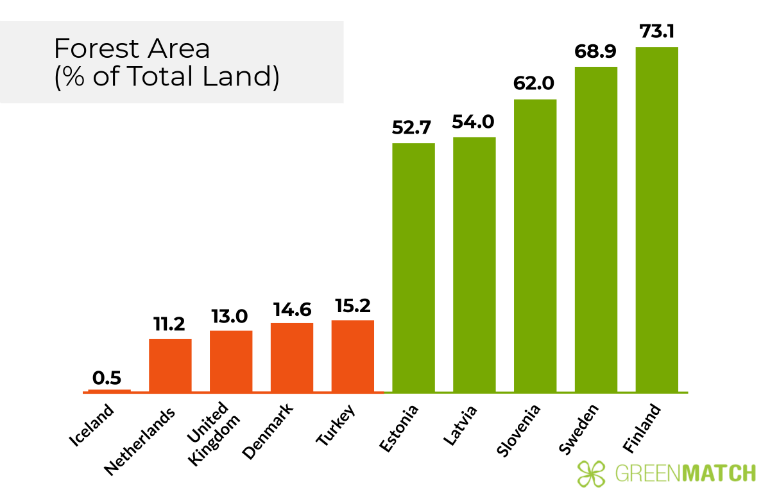
Iceland has the lowest percentage of forest area with 0.5% of the total land compared to Finland that consists of 73.1% forest area.
Methodology
Data for this project was obtained from World Health Organisation, International Energy Agency, and Data Worldbank.
To find the most polluted countries in the EU, 24 member states of the EU and the UK were analysed based on 7 metrics. The reason for analysing only 24 member states is due to the missing data for some countries. The following metrics were used in the analysis:
- Yearly carbon dioxide emissions from fuel combustion per capita
- Annual mean concentrations of PM2.5 in urban areas
- Yearly deaths attributable to air pollution per 100,000 capita
- The quality of designated drinking water sources
- Yearly amount of waste per capita
- Forest area as % of total land
- Terrestrial and marine protected area as % of total land
Of these metrics, carbon dioxide emissions, mean concentrations of PM2.5, and deaths attributable to air pollution were weighted double. The reason is that carbon dioxide is the main and most harmful pollutant that is warming Earth. After which, the pollutant PM2.5 poses the greatest health risks to people which in relation to the deaths attributable to air pollution emphasize the extreme consequence of pollution.
Dimensions
Yearly Carbon Dioxide Emissions from Fuel Combustion
This metric represents the yearly share of CO2 emissions that an individual produces via fuel combustion. The tons of CO2 emissions per capita per year.
Annual Mean Concentrations of PM2.5 in Urban Areas
PM2.5 poses the greatest health risks out of all pollutants. PM2.5 is the name of a Particulate Matter with a diameter of 2.5 μm. Because of the smalls size of this particulate matter, it can easily be breathed in through the nose and throat after which it can penetrate deep into the lungs and sometimes even enter the circulatory system. WHO has an annual guideline limit of 10 μg/m3.
This metric indicates the annual mean concentrations of PM2.5 (μg/m3) in urban areas since the concentrations of PM2.5 pollution are the highest there.
Deaths Attributable to Air Pollution
This study uses the crude rate (per 100,000 capita) which shows the deaths attributable to air pollution per year.
The Quality of Designated Drinking Water Sources
Drinking water is an important measure for pollution since we cannot live without water. Overall, drinking water sources in Europe are good, and the water is clean and safe to consume. However, in some countries its quality is lower than in the others.
Waste per Capita
This measure shows the amount of waste in kilograms that is discarded each year per individual.
Forest Areas
Vegetation is a good compensation measure for most pollution. The most clear way to show the level of vegetation per country is the percentage of forest areas of the total land of a country.
Terrestrial and Marine Protected Area
A country can have a lot of forest or vegetation areas but if these aren’t protected than these can be removed.
Dataset


We strive to connect our customers with the right product and supplier. Would you like to be part of GreenMatch?
