The Most Eco-Costly Countries in the EU
Which EU Country Is the Most Environmentally Unfriendly?
Eco-costs have been a trendy concept in environmental sciences. Being the opposite of eco-friendliness, eco-costs measure the environmental expenses of human activities, the human efforts of easing the environmental burden, and applications of technology to lower eco-costs.
The European Union has committed to cut down CO2 emissions by at least 40% by 2030 while modernising the EU's economy and delivering on jobs and growth for all European citizens. Eco-innovations and policies are carried out by EU member countries with a view to lower the human impact, improve people’s lives, and make Europe more competitive on the world market. This trend applies to key sectors such as Education. The most eco-friendly universities are showing how to adapt their overall practices to lead the change towards a more sustainable environment.
While the UK government has begun to cut down the financial subsidies for solar energy this year, concerns about achieving a greener future are on the rise, as the environmental costs have attracted public attention once again. With the determination of being less eco-costly, how far has each country come in achieving these objectives?
To highlight which countries should be celebrated and which should improve, GreenMatch has put together a comprehensive study, comprising the following elements:
Is Your Country Eco-Costly or Eco-Friendly?
GreenMatch has carried out an in-depth analysis to evaluate the level of eco-costliness of each of the 28 EU member countries. This has been done through the investigation of six green metrics that are considered to play a key role in environmental protection, and thus are considered in the calculation of the final score.
The eco-costliness of the various countries is presented in the interactive map below. By moving the cursor over each country, more detailed information is displayed.
3 Eco-Costly and 3 Eco-Friendly Countries in Europe
For each metric, the most eco-costly country is awarded 1 point, while the most eco-friendly one is awarded 28 points. That is, the higher score indicates a better performance in that metric, and lower scores present higher eco-costliness. By calculating an average score of all metrics, each country is analysed from a holistic view.
Despite having a good ranking, some countries are failing in some metrics. To illustrate this, GreenMatch has created radar diagrams for the three most eco-costly and the three most eco-friendly countries in the EU to pinpoint some highlights of this analysis. A detailed breakdown of the situation in the United Kingdom is provided, as well.
The 3 Most Eco-Costly Countries in the EU
Cyprus
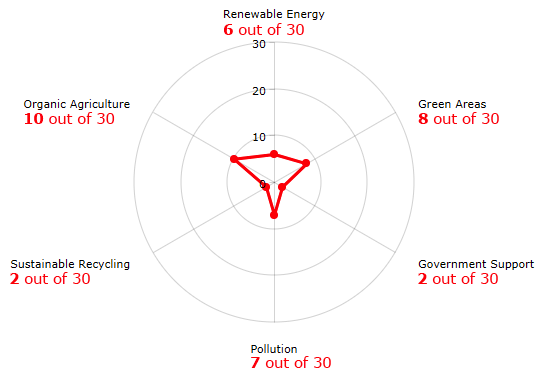
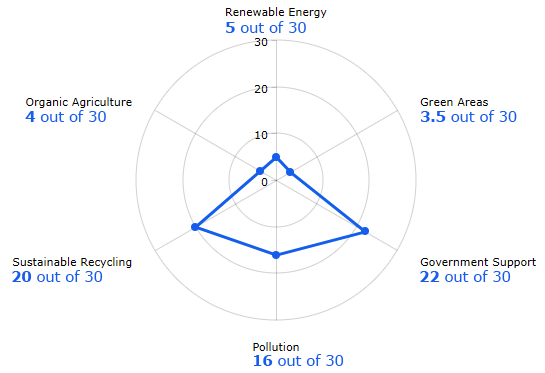
The same applies to the dimension ‘Sustainable Recycling’: Cyprus has to find better ways of reducing, reusing, or recycling the massive amount of waste they produce, which amounts to an extraordinary 640 kg of waste per capita per year. This number is alarming considering that the Cypriot population in 2016 was just below a million. For instance, the government would need to reserve a larger budget to finance renewable energy solutions, as Cyprus gets a score of 2 for this dimension. This means it is second place in the ranking of this dimension, right after Croatia. With a score of 5.83, Cyprus turned out to be the most costly for our planet among the other EU countries. The East-Mediterranean island still has a long list of policies to implement to keep the country up to date with the more eco-friendly EU states.
Ireland
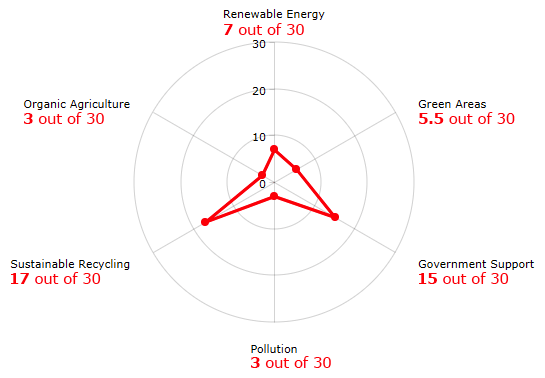
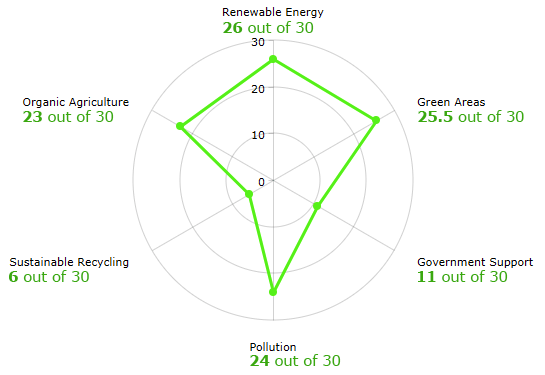
However, the Irish government clearly put emphasis on tackling environmental issues, investing €510 million in energy support and maintaining a rate of 75.19% in terms of sustainable recycling of municipal waste. With forests covering only 10.95% of total land area and 9.5% energy being generated from renewable sources, Ireland is lagging behind on the way to becoming eco-friendly. The average personal carbon footprint of the country is 13.5 tonnes, which almost double the amount of its neighbour, the United Kingdom. Even though the fresh air and unspoilt nature have made Ireland famous around the world, the third largest island in Europe still ranked as the 2nd most eco-costly country in the EU.
Malta
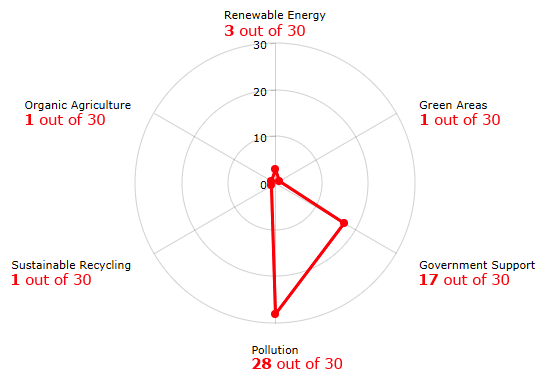
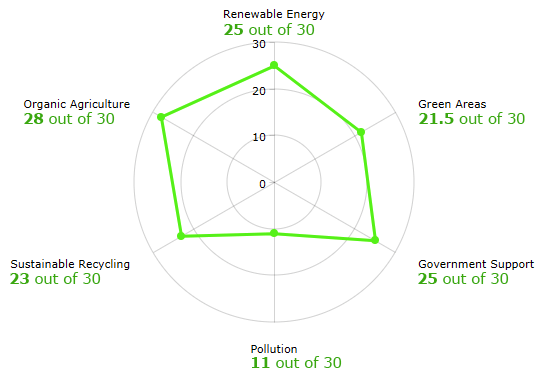
In 2015, the Mediterranean archipelagos had 3.5 km2 of forest areas for its population of less than half a million, resulting in only 7.77 m2 of green area per capita. Maybe in part due to its reduced dimensions, organic agriculture hasn’t received enough attention as well. Coming in 3rd place among the most eco-costly EU countries is Malta, with an average score of 8.50 out of 28. With an area of only 316 km2, it is the smallest country in the European Union, yet, it managed to score the worst in the ranking in three out of six dimensions in our study.
In addition, Malta scored very poorly in terms of Sustainable Recycling: the country produces more waste than highly populated countries like France or the United Kingdom. Therefore, recycling this massive amount of trash undoubtedly becomes a burden to the waste management system.
On the bright side, Malta needs to be recognised for the merit of being the leader when it comes to handling pollution: every citizen generates only 5 tonnes of greenhouse gas emissions every year, while the European average amounts to 9.22 tonnes.
Read more: World's Greenest Countries
The 3 Most Eco-Friendly Countries in the EU
Sweden
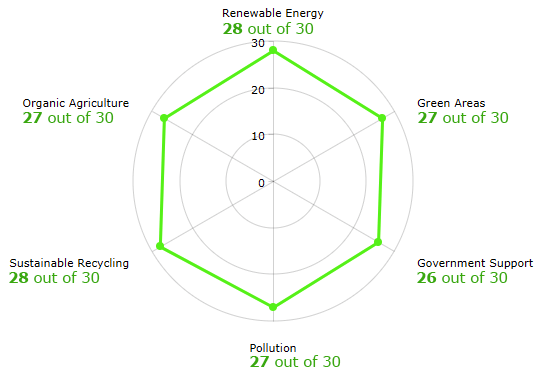
The Nordic country has much to teach the rest of the EU members. As a matter of fact, more than 68% of the energy used in heating and cooling in Sweden comes from a renewable source, far above the European average of 26%.To many, it may not be too surprising to see Sweden listed as the most eco-friendly country in the EU. With top scores in each of the six categories analysed and an average score of 27.17 out of 28, Sweden is undoubtedly the greenest renewable energy hub in Europe.
Additionally, 99% of the municipal waste generated by its inhabitants is sustainably recycled. This impressive figure shows how the Swedish waste management system is the best of all the other European Union countries, especially when comparing the average rate for the rest of the EU countries, which is only 60.55%.
Austria
Famous for its breathtaking landscapes, Austria has done a wonderful job in living peacefully with the environment. While renewable energy takes up 33.5% of the national gross energy consumption, the Austrian government values and supports the development of clean energy.
However, even though the forests cover up 46.88% of the total land, the average greenhouse gas emissions per person are still higher than the average level of EU, which may be the reason for losing the Most Eco-Friendly title to Sweden.
Latvia
In contrast, Latvia has to think about solving some of its shortcomings. For instance, the country only recycles 25% of its waste in a sustainable way. Sometimes, Latvian citizens actually have to travel relatively far away to encounter a waste disposal facility, as they are not many and are not well-distributed around the country as in other EU countries. Latvia ranks as the third most eco-friendly country in the EU, with an average score of 19.25 out of 28. The Baltic state has been given the bronze medal for the metrics Renewable Energy and Green Areas per capita, only outplayed by Sweden and Finland. This comes to no surprise since Latvia is mainly dominated by its sprawling forests that often alternate with fields and farms.
UK Portrait: How Is the United Kingdom Doing?
The United Kingdom comes in at the 10th place out of 28 of the most eco-costly countries in the EU. This analysis has revealed that the country still has a long way to go to master an eco-friendly lifestyle.
Even though it has been reported that London now has more trees than people, the UK definitely needs more green areas than the 31,440 km2 measured in 2015 to share among the 65 million inhabitants. A good point of reference for this indicator is Spain, having 3,965 m2 of green areas per capita, which is more than eight times the figure of the United Kingdom.
Another area that the UK needs to work on is the share of organic agriculture. The country implements organic agriculture to less than 3% of the total land space devoted to agriculture. With an EU average of 7.75%, the UK can do better.
On a positive note, the UK secured the 7th place in the metric measuring renewable energy support per capita given by the government. As a matter of fact, the renewable energy budget has received support amounting to €13 billion in 2012. However, despite the large disbursement, the United Kingdom’s share of renewable energy only equals 9.3% of the total gross energy consumption.
To conclude, the UK government has certainly opened the way towards a more eco-friendly future. Now, it’s a matter of setting the right objectives and implementing them to make these supportive investments worthwhile.
Methodology
To find the most eco-costly countries, all the 28 member states of the EU were analysed based on six metrics, covering different influential aspects from government policies to sustainable technology development. These six metrics are:
Relevant data was collected from Eurostat, the statistics office of the EU, from CEER (Council of European Energy Regulators), and from other governmental documents found online. Due to the fact that not all the relevant data is updated annually, this study used reports published in 2016 mostly, while certain publications are from 2012 and 2015, as marked in the reported table below.
Dimensions Measuring Eco-Costliness
The categories under scrutiny have been the following:
1. Renewable Energy
This metric represents the share of used energy that can be considered as renewable according to the Renewable Energy Directive, compared to the gross final energy consumption by each country’s end -consumers.
The Directive specifies national renewable energy targets for each EU country, considering their starting point and potential for renewables. Every two years, all members of the European Union publish a progress report regarding the achievement of the proposed renewable objectives.
2. Green Areas
Forests play an important role in fighting climate change. Policies like the Green Belt, Greenways, and Green Wedges have put great emphasis on planting more trees, purifying the air, and creating a shelter for wild animals.
A study made by the University College London indicates that urban greenery can improve a country’s capacity of breaking down CO2as effectively as tropical rainforests do. Taking London as an example, the trees planted in urban areas have outnumbered the citizens of the city. The estimated value of the benefits such as absorbing carbon dioxide, securing the soil and water, and providing shade and shelter, has reached £130 million a year.
The green area per capita and the percentage of green areas out of the entire land area are the two decisive indicators in this metric. By calculating the average of these two metrics, this category makes it possible to compare EU countries in terms of green areas.
3. Government Support
With the benefits of sustainable energy being widely recognised, preferential policies supporting energy development have taken effect and green energy has taken a growing portion of total government expenditure.
Thus, the government can allocate more financial support to the green energy industry, lowering the price of high-tech equipment and increasing the market share of sustainable forms of energy.
Taking solar panels—which have the lion’s share in the renewable energy market—as an example, a report from BNEF indicated that with $160.8 billion of investment globally in 2017, solar panels were 25% cheaper per megawatt in 2017 than in 2016.
As a consequence, the financial support in energy development provided by the government is closely connected with the country’s attitude towards environmental friendliness and its eco-costs. Divided by the size of the population, this metric measures the involvement of the government in renewable energy development based on how much investment was made per capita. The free allocation of greenhouse gas credits is not included.

4. Pollution
This metric represents the tonnes of greenhouse gas emissions artificially produced by the citizens of each country. This is considered the key indicator of the level of pollution since each gas’ global warming potential (GWP) has been integrated into a single indicator expressed in units of CO2 equivalents.
The measures taken into consideration comprised the so-called Kyoto basket of greenhouse gases—carbon dioxide (CO2), methane (CH4), nitrous oxide (N2O)—and the group of F-gases, which comprise hydrofluorocarbons, perfluorocarbons, nitrogen trifluoride (NF3), and sulphur hexafluoride (SF6).
The latest official data regarding this measure was from 2016, therefore our research took this dataset into account. The data has been considered accountable since every EU member state has to annually report its emissions to the United Nations Framework Convention on Climate Change (UNFCCC).
5. Waste Management
Urbanisation has made human activity in cities influence the environment more than ever. Municipal waste, even though this only takes up 10% of the total amount of reported waste, reflects consumption patterns, influences the environment, and shows a country’s political profile due to its complex and varied composition.
In this section, sustainable waste treatment methods are analysed by summing up the following three ways of waste handling; the higher the percentage of the total municipal waste generation, the greener the country:
6. Organic Agriculture
Last but not least, this metric measures the share of utilised agricultural area (UAA) that is cultivated organically with respect to the total amount of land used for agricultural purposes, country by country. The data takes into account the existing organically-farmed areas and the land in process of conversion to organic farming.
Dataset


We strive to connect our customers with the right product and supplier. Would you like to be part of GreenMatch?
