What is the Average Cost of Electricity per kWh in the UK?

For several reasons, understanding the average electricity cost per kilowatt-hour (kWh) in the UK is crucial. It allows consumers to make informed decisions about their energy usage, helps businesses plan operational costs, and provides insights into the country's energy market dynamics.
In 2023, the UK experienced notable changes in its energy market. The cost of electricity per kWh was 27p, with the Energy Price Cap (EPC) set at £1,923 per year for a typical household. However, it's important to note that this cap applies to the unit cost per kWh, not the total amount paid. Therefore, households with higher energy usage would pay more than the capped amount.
The fluctuations in energy prices had significant impacts on consumers. According to a survey conducted in November 2023, nearly half of the adults in Great Britain were using less fuel in their homes due to the rising cost of living. Additionally, 38% of adults who pay energy bills found them challenging to afford.
Factors, including limited gas reserves, environmental limitations, and high demand for liquified natural gas from Asia, influenced the energy market in 2023. These factors led to soaring energy prices, with the average electricity bill in the UK rising from £764 in 2021 to nearly £2,000 in 2022.
Looking ahead, energy prices are expected to rise again in January 2024 due to typical seasonal fluctuations in energy demand. The Energy Price Cap is set to increase to £1,928 per year for a typical household from 1 January 2024, which translates to a per kWh cost of 28.6p for electricity.
As we move into 2024, we must continue monitoring these trends to effectively navigate the ever-changing energy landscape. Today, the energy price cap for electricity has been reduced.
- The average unit price for electricity is now 22.36p per kWh.
- The daily standing charge for electricity is 60.12p per day.
- The daily standing charge will be 31.66p for gas.
These figures are based on the price cap for customers on standard variable tariffs paying by direct debit. It's important to note that these are average figures and may vary slightly by region.
Average Cost of Electricity per kWh in the UK for 2024
In 2023, the average cost of electricity per kWh in the UK was 27p. Various factors, including the wholesale cost of energy, operational costs for energy suppliers, and government policies, influence this cost. One such policy that significantly impacted the cost of electricity in 2023 was the Energy Price Cap (EPC).
As of September 5, 2024, the average cost of electricity per kWh in the UK is 24.5p. This price is set under the current Energy Price Cap, which runs from October 1, 2024, through December 31, 2024. The price cap for electricity has risen by approximately 9.6%.
The EPC was set at £1,717 a year for a typical household.
According to Ofgem, this represents a 10% increase from the previous cap of £1,568 that was in effect from July to September 2024.
The EPC was initially introduced with the best intentions of protecting consumers from being overcharged. However, it has been argued that the EPC has gone far beyond its intended purpose and is actively harming competition.
The EPC now functions not as a price cap but as the de facto price for almost every consumer, covering 29 million households. This has resulted in significantly higher prices for consumers and has driven inflation.
Notably, this £1,717 figure is based on typical annual consumption for a dual fuel customer paying by direct debit. The amount households pay will depend on their energy usage, location, and payment method.
The Centre for Policy Studies report emphasises the importance of rethinking the EPC's role. Here is a table summarising the energy price cap in each quarter.
| Quarter | Energy Price Cap (£) |
|---|---|
| Q1 2023 | £1,928 |
| Q2 2023 | £1,690 |
| Q3 2023 | £1,568 |
| Q4 2023 | £1,717 |
This represents a significant decrease from earlier in 2024:
- The price cap has fallen from £1,690 in the April-June 2024 period to £1,568 for July-September 2024, a reduction of £122 or about 7%.
- Compared to the January-March 2024 period, when the unit rate was 29p/kWh, the current rate of 22.36p/kWh represents a substantial decrease.
Will Energy Prices Change Rise in 2025?
The predictions of a decrease in electricity prices have changed throughout the year till today; the immediate outlook for 2024 in the last quarter has seen a fall and rise in energy costs for UK households.
While the energy market remains volatile, current forecasts suggest that energy prices in the UK may continue to face upward pressure in 2025, albeit at a more moderate pace compared to recent years.
According to Cornwall Insight's latest projections, the energy price cap will continue to rise in early 2025.
The energy price cap, which limits the maximum amount suppliers can charge households for each gas and electricity unit, rose from £1,568 to £1,7178 as of September 2024, pushing average household bills up more than 5%. However, these figures indicate a gradual increase in household energy costs on standard variable tariffs throughout 2025.
Continued investment in renewable energy infrastructure may help stabilise prices in the long term. The UK government's target to cut energy demand by 15% by 2030 could potentially lead to savings on household bills. Any escalation in global conflicts or trade disputes could lead to price volatility.
Despite potential price increases, there are some positive indicators for consumers. The proportion of households in fuel poverty is projected to decrease slightly to 12.7% (3.12 million) in 2024, with the average fuel poverty gap expected to fall by 8%. Experts estimated that 55.5% of low-income households are projected to live in properties with improved energy efficiency ratings.
To mitigate the impact of potential price rises in 2025, Installing solar panels can significantly reduce your monthly electricity bills by generating clean, renewable energy, potentially saving you thousands of dollars in the long term. Explore detailed insights on solar panel costs to learn more about how solar panels can be a cost-effective solution for your home.
Regional Variations in Electricity Costs
Electricity costs in the United Kingdom vary significantly by region. This variation is influenced by several factors, including supply and demand, the cost of distributing energy, and the amount of power used for heating in colder regions.
The cost of electricity is a significant component of household expenses, and understanding these regional differences can help consumers make informed decisions about their energy use.
Why They Vary Across Regions in the UK
Different distribution network operators (DNOs) serve different areas of the UK. These companies manage the local electricity networks and charge energy suppliers for using their infrastructure. The costs vary depending on factors such as:
- Population density
- Geographical challenges
- Age and condition of the network
- Required upgrades and maintenance
For example, rural areas with sparse populations often face higher distribution costs due to the need for more extensive infrastructure to serve fewer customers.
All combination of factors determines electricity costs. The most significant single factor is the wholesale cost of gas and electricity, which is about 40% of the overall price.
The next-largest factor is network costs, which are the energy distribution costs. Other fees include operating costs (your supplier's overhead), VAT, markup, and costs relating to green energy subsidies that energy companies must pay by the government.
In areas with fewer people, the per-unit cost is driven up.
Conversely, in densely populated regions, energy companies can buy from generators in bulk, which tends to lower the price per unit.
The cost of distributing energy also varies by region, with areas that use more electricity for heating, such as North Scotland, having higher distribution costs. Customers use more electricity for heating, which is factored into the distribution costs.
Despite these variations, it's important to note that the UK has recently seen some stability in wholesale electricity prices. Even with a 5% increase in the price cap announced for April 2024, average electricity prices are much cheaper than they have been.
The energy lost during transmission from power plants to homes and businesses varies by region. Areas further from generation sources typically experience higher losses, which are factored into pricing.
Detailed Comparison of Electricity Costs in Different Regions
In 2024, the most expensive average electricity bill was found in London, with an average electricity unit rate of 25.69p per kWh.
On the other hand, the Northern region has the cheapest electricity, with an average cost of 23.19p per kWh.
Here is a detailed comparison of electricity costs in different regions of the UK as of September 2024:
| Region | Average Single Rate Unit Price (p)kWh | Average Standing Charge (p) per day |
|---|---|---|
| North West | 25.01 | 52.04 |
| Northern | 23.19 | 72.10 |
| Yorkshire | 23.51 | 68.32 |
| Northern Scotland | 24.96 | 61.98 |
| Southern | 24.62 | 64.28 |
| Southern Scotland | 23.96 | 64.17 |
| North Wales & Merseyside | 25.39 | 67.89 |
| London | 25.69 | 41.59 |
| South East | 25.24 | 57.84 |
| Eastern | 25.21 | 50.84 |
| East Midlands | 23.77 | 56.90 |
| Midlands | 23.83 | 63.62 |
| Southern Western | 24.18 | 68.12 |
| South Wales | 24.49 | 64.12 |
| UK Average | 24.50 | 60.99 |
It's important to note that these costs can fluctuate due to changes in wholesale energy prices, government policies, and other factors. Therefore, consumers are encouraged to regularly compare electricity prices to ensure they get the best deal for their region.
Comparison with Previous Years (2021-2023)
The UK's electricity cost has been a significant concern recently, with prices rising above the historical average between 2021 and 2023.
In 2021, the overall selling value of UK energy was £69.7 billion, marking a 23% increase from the previous year. This trend continued into 2022, with the UK experiencing a significant energy crisis that saw annual household bills rise from around £1,000 to over £3,500 in October 2022.
This crisis was driven by various factors, including increased demand during the post-COVID reopening of economies, Russia's invasion of Ukraine, and a subsequent squeeze on gas supplies into Europe.
By 2023, energy prices had stabilised somewhat but remained double what they were at the start of 2021. The average electricity bill in the UK as of 1 October 2023 was £738.45 per year, and the average gas and electric bill for a typical household with median usage was projected to be £2,020 per year in early 2024.
However, the UK's energy regulator, Ofgem, has set the average electricity bill for a typical household paying by direct debit will be £772.74 per year from April 1 to June 30, 2024. This is based on the new energy price cap set at 24.5p per kWh for electricity, with a daily charge of 60.1p.
UK Electricity Prices Update as of September 2024
The landscape of electricity pricing in the United Kingdom has seen a significant update as of July 1, 2024. Ofgem, the UK's energy regulator, has announced changes to the energy price cap, which sets the maximum amount that energy suppliers can charge customers for each unit of electricity and the standing charge.
As of July 1, 2024, this cap came into effect on July 1, 2024, and will remain in place until September 30, 2024. However, Ofgem has announced that the price cap will rise to £1,717 per year from October 1 to December 31, 2024. This represents an increase of approximately 9.5% from the current cap.
These rates are averages across England, Scotland, and Wales and include VAT.
The average unit price per kilowatt-hour (kWh) for customers on the default tariff (Standard Variable Tariff or SVT) is now capped at 24.50p for electricity, with a daily standing charge set at 60.10p. This represents a reduction from the previous cap set between January 1 and March 31, 2024, where the unit rate was 29p/kWh for electricity, and the daily standing charge was 53p/day.
Despite recent decreases, energy prices remain significantly higher than pre-crisis levels. The typical annual energy bill is about 30% higher than winter 2021/22.
Factors Influencing Price Changes
Several factors have contributed to these significant price changes. One of the main drivers has been the UK's dependence on gas for heating and electricity generation. The cost of buying gas, which is heavily used in electricity production, has increased, leading to higher electricity production costs that are then passed on to customers.
Several factors are contributing to the upcoming increase in energy prices:
- Rising wholesale prices: Recent tensions in the Russia-Ukraine conflict have increased wholesale energy costs.
- Supply issues: The closure of the Nord Stream 1 pipeline has reduced gas supply to Europe, affecting prices.
- Increased demand: As economies continue to recover from the pandemic, energy demand has risen
UK gas prices increased due to tighter supply conditions, primarily driven by ongoing maintenance work in Norway. The full maintenance shutdown of the Langeled pipeline has reduced Norwegian flows to the UK to 16 mcm/day, significantly below usual levels.
UK power prices have shown marginal increases, reflecting higher gas prices and supported by a modest rise in UK carbon prices. Below-average wind speeds will continue throughout the week, raising gas demand for power generation.
However, the introduction of Ofgem's energy price cap in January 2019 led to most suppliers basing their standard variable rate tariffs on the unit rates capped by the price cap. This led to a maximum price that most suppliers can charge for each unit of gas and electricity, which increased by 12% in October 2021 and 54% in April 2022 and was due to increase by 80% in October 2022.
Moreover, EU gas storage remains well-stocked at 92.40% capacity, ensuring supply security despite ongoing maintenance activities and geopolitical concerns. The UK is set to receive three LNG cargoes by September 11, which should help alleviate some supply concerns in the near term.
Another factor is market dynamics, such as competition among energy suppliers, which have also influenced prices. As suppliers compete for customers, they need to balance the need to offer competitive prices with the need to cover their costs and remain profitable.
The table below shows the average electricity cost per kWh for (2021-2024) in the UK:
| Year | Average Electricity Bill (£) |
|---|---|
| 2021 | £1,084 |
| 2022 | £1,978 |
| 2023 | £ 1,834 |
| 2024 | £603.72 |
Price Cap History and Percentage Variation
The energy price cap has seen a series of increases and decreases since its inception. Here is a summary of the cap amounts and their percentage variations according to Ofgem
| Date | Cap Amount (£) | % change vs previous |
|---|---|---|
| January 2019 | £1,137 | N/A |
| April 2019 | £1,254 | N/A |
| October 2019 | £1,179 | N/A |
| April 2020 | £1,162 | -1.44% |
| October 2020 | £1,042 | -10.29% |
| April 2021 | £1,138 | 9.21% |
| October 2021 | £1,277 | 12.21% |
| April 2022 | £1,971 | 54.32% |
| October 2022 | £3,549 | 80.06% |
| January 2023 | £4,279 | 20.57% |
| October-December 2023 | £1,834 | -57.16% |
| January-March 2024 | £1,928 | 5.13% |
| April - June 2024 | £1,690 | 12.3% |
| July - September 2024 | £1,568 | 7% |
| September 2024 | £1,717 | 10% |
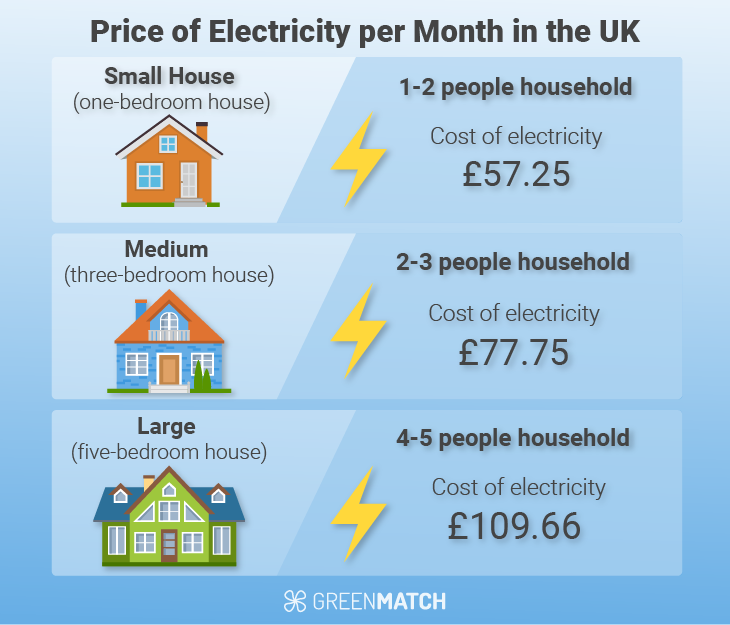
Average Energy Bills By House Size
Understanding the average energy bills by house size can provide valuable insights into your energy consumption and costs. By comparing your bills with the average for your house size, you can identify if you are using more or less energy than expected and take steps to manage your energy usage more effectively.
According to Ofgem, the average British household of 2-4 people uses 2,900 kWh of electricity and 12,000 kWh of gas. However, these figures can vary significantly depending on the size of the house and the number of people living in it.
Here is a detailed breakdown of the average annual consumption and cost for different house sizes:
| House Size | Average Annual Gas Consumption (kWh) | Average Annual Electricity Consumption (kWh) | Average Annual Gas Cost (£) | Average Annual Electricity Cost (£) | Average Total Cost (£) |
|---|---|---|---|---|---|
| 1-bedroom house/flat (1-2 people) | 8,000 | 1,800 | £630 | £622 | £1,252 |
| 3-bedroom house (2-3 people) | 12,000 | 2,900 | £880 | £868 | £1,748 |
| 5-bedroom house (4-5 people) | 17,000 | 4,300 | £1,180 | £1,181 | £2,361 |
Electricity Costs and Payment Type
A combination of factors determines electricity costs. The cost of generating electricity, the price of buying energy from generators, and the fees charged by local distribution networks all play a role.
Payment Types
When paying for electricity, consumers in the UK have several options. These include:
- Direct Debit: This is the most common payment method. Customers pay a fixed monthly amount based on their estimated annual usage.
- Standard Credit: Customers receive a quarterly bill and pay the total amount within a specified period.
- Prepayment: Customers pay for their electricity in advance by topping up a meter. This can help manage budgets but is often more expensive than other payment methods.
Comparison of Payment Types
Each payment type has its advantages and disadvantages. Direct debit offers convenience and can often lead to discounts, but it requires careful management to avoid overpaying or underpaying. Paying on receipt of the bill gives more control over when you pay, but it can lead to larger, less manageable payments.
Prepayment offers the ability to pay as you go, but it can be more expensive and requires regular top-ups.
| Payment Type | Average Electricity Cost per kWh (pence) | Advantages | Disadvantages |
|---|---|---|---|
| Direct Debit | 22.36 | Convenience, lowest rates | Requires careful management |
| Standard credit | 23.54 | Control over when you pay | Higher rates can lead to larger payments |
| Prepayment | 21.59 | Pay-as-you-go helps manage budget | Requires regular top-ups, which can be inconvenient |
Direct Debit payments typically offer the lowest rates and can save more than £100 a year compared to paying on receipt of a bill.
What Electricity Tariffs Are Available?
Understanding the different types of electricity tariffs can help you decide your energy use. Whether you're looking for flexibility, price stability, or the ability to manage your budget, a tariff can meet your needs.
| Tariff Name | Price (£) | Usage Limit | Description |
|---|---|---|---|
| Standard Variable | 24.5p/kWh | No limit | Default tariff with no end date. Rates can go up or down based on market conditions. |
| Fixed-Rate (1 year) | 23.5p/kWh | Fixed | The price per unit of electricity is fixed for a set period |
| Economy 7 and Economy 10 (Off-Peak) | 13.5p/kWh | 7 hours | Cheaper rates are offered during off-peak hours. |
| Green Tariff | 25.0p/kWh | No limit | The supplier matches the electricity used with renewable energy purchases. |
| Prepayment Tarif | 23.72p/kWh | Meter amount of credit | Pay for electricity in advance by topping up a meter |
Future Trends and Predictions
The UK is facing a challenging year ahead, with energy bills expected to rise significantly. Factors such as limited gas reserves, strong Asian LNG demand, low wind generation, and rising carbon prices increase energy costs.
As we move through 2024, energy bills in the UK remain a concern for many households.
Ofgem's current price cap from July 1, 2024, to September 30, 2024, is set at £1,568 per year for a typical household using gas and electricity and paying by Direct Debit. This represents a decrease from previous levels.
However, analysts at Cornwall Insight predict that the price cap will rise again in October 2024. They forecast an increase of 10% to £1,723 per year for the average home.
For the longer term, Cornwall Insight has forecasted that energy prices will remain relatively high until the late 2030s. This prediction is based on various factors, including the transition to renewable energy sources and potential changes in government policy.
The Office for National Statistics reports that electricity prices have increased by an average of 5.5% per year between 2000 and 2020. This trend is expected to continue or accelerate due to increasing demand as the UK electrifies its heating and transport systems.
It's important to note that these predictions are subject to change based on various factors, including geopolitical events, changes in global energy markets, and shifts in domestic energy policy.
However, households and businesses are encouraged to focus on energy efficiency measures and explore renewable energy options to mitigate the impact of potential future price increases.
How Much Will Electricity Cost Per kWh in January 2025?
The cost of electricity, measured per kilowatt-hour (kWh), is a significant consideration for consumers, impacting household budgets and business operating costs. As we look ahead to January 2025, many wonder how much electricity will cost per kWh. Electricity costs per kWh are set to rise.
According to Ofgem, the UK's energy regulator, the previous unit rate for electricity is expected to be around 25.80p/kWh in January 2025. This is a slight increase from the earlier rates, driven 'almost entirely by rising international wholesale energy market costs due to market instability and global events.'
The price cap is forecast to rise slightly to £1,923 per year for a typical household in January 2025, with a further slight increase to £1,929 in April 2025. This prediction considers the current market trends and potential changes in the energy landscape.
The average daily standing charge for electricity will be approximately 65.93p/day in January 2025. This represents a slight increase from the current rates, reflecting the ongoing costs of maintaining and upgrading the energy infrastructure.
This increase comes when the UK is still amid an acute energy cost crisis, as it has been for the past two years. The rising energy prices and the escalating climate emergency underscore the need for large-scale energy efficiency and demand reduction solutions to reduce energy bills, improve energy security, and lower carbon emissions.
It's important to note that these figures are predictions and may change based on market conditions and regulatory decisions. The energy regulator, Ofgem, reviews and updates the price cap every three months, influencing the unit rates and standing charges.
Based on these predictions, the annual energy bill for a typical dual-fuel household paying by Direct Debit is estimated to be around £1,805 in January 2025. This represents an increase from the current price cap level, reflecting the ongoing challenges in the energy market.
Looking Ahead
Electricity costs will likely stay above pre-crisis levels. However, the UK's push for renewable energy may stabilise prices over time. Consumers should remain informed about energy trends. They should also explore energy-saving measures to manage their electricity costs.
As we continue to invest in and transition towards renewable energy, we can expect to see a reduction in electricity prices over time. This transition benefits consumers by potentially lowering energy costs and contributes to the global effort to combat climate change.
We strive to connect our customers with the right product and supplier. Would you like to be part of GreenMatch?
