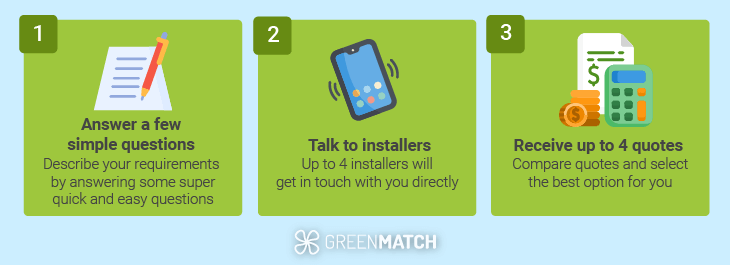
Answer these simple questions and we will find you the BEST prices
Which type of solar quotes do you need?

Get up to 4 quotes by filling in only 1 quick form
Slash your energy bills by installing solar panels
For the average 2-3 bedroom house
Solar Panels for UK Houses - Updated October 2025 Guide

In this article, we’ll walk you through everything you should know about residential solar panels for UK homes, including the available types, their pros and cons and how to get the best solar panels in the UK.
First, let’s briefly look at the 4 most important questions pertaining to solar panels and installing them:
Are solar panels worth it?
Are solar panels worth it in the UK? Yes.
A typical 3-bedroom house can achieve savings of £32,608 over 25 years while staying energy-independent. The return on investment can amount to £19,000 - £21,000.
Prices and savings figures shown are estimates. For the best prices we recommend contacting professional installers. Use our solar panel calculator to estimate potential costs and savings based on your location.
Solar panel savings and break-evens can be further increased by exporting energy back to the grid.
With solar panels, you also reduce carbon emissions from your home by 1 tonne of CO2 per year, according to the Energy Savings Trust. It is also worthwhile to consider the question, “do solar panels increase home value?”. In most cases, yes. Solar panels can boost the value of a property by roughly 6.8%, adding to the resale value.
How much do solar panels cost?
GreenMatch’s research has found the average price of a domestic 4kW solar panel system in the UK can range between £6,600 - £8,100 (including installation costs), depending on the type of panels you install, their wattage and the manufacturer.
| House size | Solar system size | Solar panel costs (inc. installation) | Annual savings | Break-even point | Savings after 25 years |
|---|---|---|---|---|---|
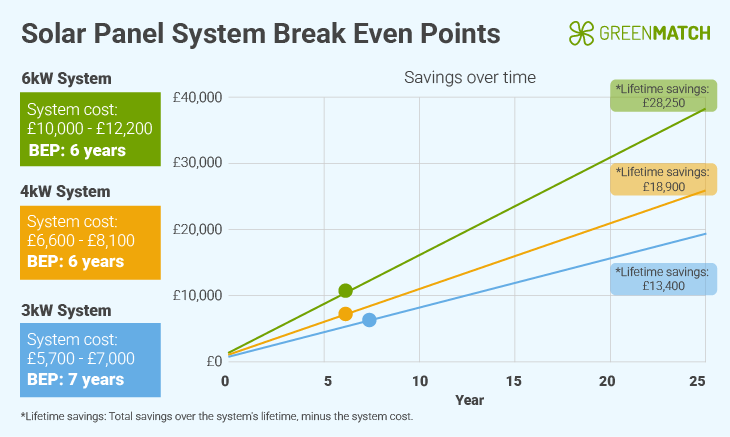
| Small; 1-2 bedrooms | 3kW | £5,700 - £7,000 | £783 | 7 years | £19,578 |
| Medium; 2-3 bedrooms | 4kW | £6,600 - £8,100 | £1,304 | 6 years | £32,608 |
| Large; 4-5 bedrooms | 6kW | £10,000 - £12,200 | £1,567 | 6 years | £39,163 |
Based on average electricity consumption (kWh) according to Ofgem, and estimated electricity generated per year (kWh). These costs are estimates. Get a local installer QUOTE now!
Additional components can also add to the price. If you'd like to install a solar storage battery, it will bring the total to £13,000 - £15,500 for the average 2 to 3-bedroom house.
Are there solar panel grants available?
Yes, you can break even on your solar panel investment faster with grants and can get a discount if you are eligible, potentially receiving fully free solar panels or a modest discount compared to the prices listed above. As of 2024, there are several schemes available depending on where you live.
As of April 2022, 0% VAT applies to all energy-saving materials, including solar panels and solar batteries. Based on the average 4kW system and battery storage costs, the average home saves £2,850 compared to the original 20% tax rate.
The Smart Export Guarantee (SEG) allows you to receive payments for selling surplus energy back to the grid, resulting in potential savings of up to £1,141 annually for a medium-sized home with a 4kW system and battery storage. This can increase your annual savings from roughly £1,304, resulting in an average ROI of £32,608 across the lifespan of the panels.
Energy Company Obligation Scheme (ECO4) permits low-income households the opportunity to replace their inefficient heating system with a more efficient and environmentally friendly system. The grant can pay for partial or (potentially) the full cost of solar panels depending on recommendations by a professional.
The ECO4 scheme provides funding to a range of low-income households. Here’s a table that breaks down the income thresholds:
| Single Claimant: | Qualifying Maximum Household Income |
| – 1 Child (up to age 18) | – £19,900 |
| – 2 Children (up to age 18) | – £24,800 |
| – 3 Children (up to age 18) | – £29,600 |
| – 4 Children (up to age 18) | – £34,500 |
| Member of Couple: | Qualifying Maximum Household Income: |
| – 1 Child (up to age 18) | – £27,500 |
| – 2 Children (up to age 18) | – £32,300 |
| – 3 Children (up to age 18) | – £37,200 |
| – 4 Children (up to age 18) | – £42,000 |
Does the UK weather work for solar panels?
Solar panels work perfectly fine in UK weather, including the winter. Despite fewer sunshine hours than a lot of other countries, a 4kW system can be sufficient to meet the average monthly energy consumption in the UK and compensate for the less sunny winter days. Additionally, if you have a solar battery system, you can store your excess electricity for a dark, wintery day or to ensure you have energy for use at night.
Commercial solar panels and residential solar panels are also built to withstand rain, including excessive downpours. They will remain unaffected and can operate efficiently throughout. In fact, a bit of rainwater can help clear dust and keep them clean.
Most domestic solar panels in the UK are around 15-26% efficient, with most solar panel manufacturers in the UK providing efficient monocrystalline options. As a benchmark, experts recommend installing panels with efficiency rates exceeding 22%. While this number may not sound like a lot, solar technology has improved, offering outputs and efficiencies far better than a decade ago.
While sunlight hours vary across the year, a system of the right size can compensate by overproducing during the summer months. This can be a great time to earn back money through the Smart Export Guarantee, allowing you to compensate for the lower energy at other times of the year. Over the course of a year, the SEG can help bring your total savings to £1,141.
While you may not meet your electricity needs for 2 or 4 months, you can overproduce for the rest of the year and earn back the money by exporting to the grid.
This ensures that your full energy requirements are met when looking at the year as a whole, and any extra energy becomes additional income. Are you ready to reap the benefits of the points above? Then, it's important to find the best installer for the job.
Contacting several solar installers can take hours and be very stressful when done alone. Fortunately, we can connect you with up to 4 approved installers near you for free!
Just fill in our 30-second form and we’ll do the rest.
- Quotes from local engineers
- Payment by finance available
- Save up to £1,567 per year


- What are solar panels and how do they work?
- Are solar panels worth the investment?
- Cost of solar panels based on household size
- Are there UK grants to reduce the costs of solar panels?
- Is your house suitable for solar panels?
- Are solar panels efficient in the UK?
- How many solar panels do you need for your home?
- Is adding a solar battery a good idea?
- 9 practical questions every homeowner needs to answer before buying solar panels
- What does a solar battery installation look like?
- How can you find the right solar panel supplier?
- Frequently asked questions
What are solar panels and how do they work?
Solar panels or photovoltaic systems convert sunlight directly into electricity. Multiple solar cells are connected and packed together in a frame to form a solar panel, and multiple solar panels are connected to form a solar array.
 1 2 3 4 5 6 7
 Solar photovoltaic panels transform sunlight into electricity which passes through a charge controller. This electricity is in the form of direct current (DC) electricity, so it needs to be converted to alternating current (AC) so it can be used in the home. As a result, it passes through the micro-inverters in the panel or a safety DC switch and a separate string inverter (if the panels don’t have in-built inverters). While most modern solar panels have micro-inverters, some don’t, so they need a solar inverter to convert DC into AC.
We have answered some of the most common technical questions about solar panels in the boxes below. Click on each one to learn more.
Already have an idea of what you’re looking for and don’t want to waste any more time? Simply click the button below to get up to 4 solar panel quotes. It’s completely free, and you’re under no obligation to accept any of the quotes you receive.
Solar panel types explained
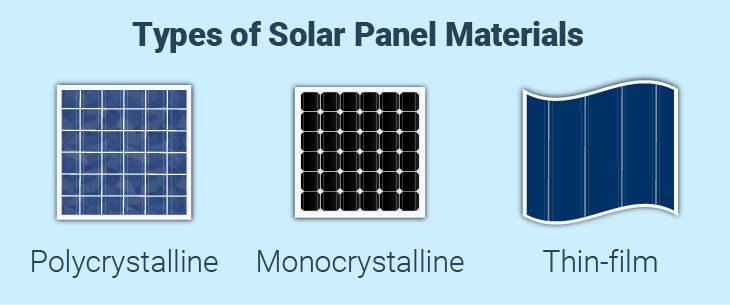
There are 3 main categories of solar panel materials: monocrystalline, polycrystalline, and thin-film solar panels. Monocrystalline panels are the most expensive and most efficient but are also the most common and comprise the best solar setup for home energy.
| Type | Price per Watt | Efficiency | Lifespan |
|---|---|---|---|
| Monocrystalline | £1 to £1.50 | 20%- 26% | 25 years |
| Polycrystalline | £0.90 to £1 | 13%-20% | 25 years |
| Thin-film | £0.75 | 7%-13% | 20 years |
Polycrystalline panels come in second and thin-film panels are the least efficient overall. Most solar panel manufacturers provide monocrystalline systems nowadays.
More efficient versions of monocrystalline systems also exist, but these can be prohibitively expensive. Most domestic systems tend to have 20% to 26% efficiency but these high-cost systems are not generally available on the market.
Are solar panels worth the investment?
Yes, solar panels are worth the investment for the average UK home. They can provide savings of up to £1,304 for the average 2 to 3-bedroom house, with a breakeven point of 6 years. The table below outlines the savings and savings after 25 years for various types of homes:
| House size | Solar system size | Solar panel costs (inc. installation) | Annual savings | Break even point | Savings after 25 years |
|---|---|---|---|---|---|
| Small; 1-2 bedrooms | 3kW | £5,700 - £7,000 | £783 | 7 years | £13,000 - £15,000 |
| Medium; 2-3 bedrooms | 4kW | £6,600 - £8,100 | £1,304 | 6 years | £19,000 - £21,000 |
| Large; 4-5 bedrooms | 6kW | £10,000 - £12,200 | £1,567 | 6 years | £29,000 - £31,000 |
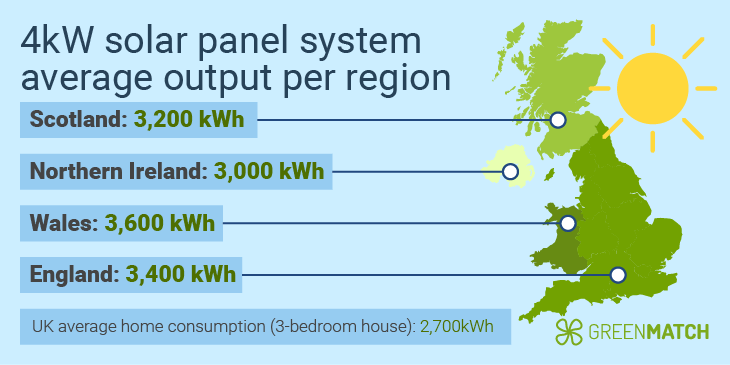
Average-sized households in the UK will require a 3 or 4kW solar system. A 4kW system produces a solar panel output of 3,400kWh per year and costs approximately £6,600 - £8,100. This can cover the average annual electricity consumption of a household (2,700kWh, according to Ofgem) by between 105% and 120%.
Solar panels can be worth it for your home for many reasons, but they may not be suitable for every buyer. That’s why it’s important to consider their pros and cons:
Solar panel pros:
- Generate your own energy: Solar panels accrue cost-free electricity. They can reduce energy costs by up to £1,304 for the average-sized home.
- Reduce your carbon footprint: Installing solar panels for home energy can help cut an average of around one tonne of carbon annually, according to the Energy Savings Trust.
- Earn money back: With the SEG, you can earn compensation for each kWh that you sell back to the grid. Even with an average tariff rate of 10.8p/kWh, a home's savings go up to £1,141 per year for a 3-bedroom home.
- Achieve energy independence: A solar system can generate electricity without any connection to the fossil fuel grid. While total independence is not likely for all homes, it can provide insulation from fluctuating energy costs as electricity gets more expensive in the future.
- Low maintenance: After installation, solar panels require very little maintenance. In fact, rain can clean them up automatically. Solar panels do not need servicing unless they are losing output suddenly, in which case you should call an installer. Crucial performance metrics can be easily monitored using an app.
- Increased home value: Solar panels can increase home value by up to 6.2% to 6.8%, which can make them attractive for house valuations from officials. This can make your property more attractive and easier to sell in the future.
Solar panel cons:
- High initial costs: The biggest reservation most people have with solar panels is the initial cost. Aside from purchase costs being between £6,600 - £8,100 on average, including labour costs. However, solar panel grants can help ease the cost of installation for many homeowners.
- Dependent on sunlight: Solar panels are dependent on sunlight and provide more energy wherever sunlight hours are higher. Thankfully, they work perfectly fine in the UK, requiring 4 to 5 sunshine hours to power most homes with the appropriate size system.
- Require proper placement: Solar panels are not viable on north-facing roofs or ones with inadequate angles, i.e. anything outside of 30° to 50° slope. For flat roof solar panels, you will need to factor in ballasts and stands, which can be angled manually for optimal performance.
Overall, solar panels are a great investment that helps households achieve energy independence, earn back money and increase home value. Despite the price, installation costs can be decreased with the help of grants, covering the total cost of the panels in 8 to 10 years.
Cost of solar panels based on household size
The average domestic solar panel system costs £6,600 - £8,100 for a 4kW system ideal for homes with 2-3 bedrooms. This can require between 8 (450W) and 10 (400W) solar panels. The total cost of solar panels depends on how many panels you need for your home, which in turn is dependent on your energy consumption and how many panels you can fit on your roof.
Generally, the more expensive the system, the more electricity it generates and the higher the savings. The table below shows the annual savings on your electricity bills per system size, how much you earn through Smart Export Guarantee (SEG) payments, and how long it takes to break even.
| Household size | System size | System cost | Annual savings | SEG payment | Total annual savings inc. SEG |
|---|---|---|---|---|---|
| 1-2 bedroom | 3kW | £5,700 - £7,000 | £783 | £41.25 | £887 |
| 2-3 bedrooms | 4kW | £6,600 - £8,100 | £1,304 | £38.50 | £1,141 |
| 2-3 bedrooms | 5kW | £8,300 - £10,200 | £1,304 | £85 | £1,518 |
| 4-5 bedrooms | 6kW | £10,000 - £12,200 | £1,567 | £55 | £1,705 |
These costs are estimates. Get a local installer QUOTE now!
The calculations in this table are an illustration based on the assumption that a household is using the annual national average of 2,700kWh (Ofgem) and that as much of the electricity usage as possible is covered by solar panels.
It is also based on the assumption that 850kWh of electricity is generated per year for a 1kW solar panel system, an average SEG tariff of 10.8p/kWh (April 2024), and the price of electricity as of April 2024. The table makes a broad estimate and figures may vary according to the size, type, and quality of the solar panel system, as well as export tariffs.
Another factor that can add extra costs to your system is whether you pair it with a battery. While they add to the price, they can lead to energy independence and add £4 to £5 of savings per day (amounting to over £1,400 per year) on top of solar savings.
Generally, a 6 to 10kWh range will be fine for the average panel system (3kW to 4kW systems). The table below shows how big of a battery you need for your solar panel setup:
| Solar panel system | Required solar battery size | Solar battery cost | Total cost (inc. solar panel system) |
|---|---|---|---|
| 2kW | 4 - 5kWh | £3,500 – £5,000 | £6,000 - £8,500 |
| 3kW | 6 - 7 kWh | £5,000 - £8,000 | £9,500 - £13,500 |
| 4kW | 9 - 10 kWh | £8,000 - £9,500 | £13,000 - £15,500 |
| 5kW | 11 - 12kWh | £9,000 – £10,000 | £16,500 - £20,500 |
These costs are estimates. Get a local installer QUOTE now!
While solar batteries can add a bit more to the price of a solar panel system, they provide great benefits. Firstly, they allow for energy to be stored and later used at night. Secondly, even without solar panels, using a storage system can allow homeowners to store energy during off-peak hours so they can use it when it gets more expensive, thus cutting energy costs.
If you’re interested in solar batteries or a panel system, finding the right installer can help lower costs and ensure proper installation. You can either take the hard way of spending hours calling up local installers and requesting tailored quotes or the easy way by completing our short 30-second form to receive up to 4 tailored quotes. Click the button below to start receiving free, no-obligation quotes.
- Quotes from local engineers
- Payment by finance available
- Save up to £1,567 per year
Are there UK grants to reduce the costs of solar panels?
In the UK, you can earn and save money on your domestic solar PV systems with various solar panel grants and financial schemes. See the table below for an overview.
| Solar panel grant/Scheme | Eligible regions | Run time | Potential savings |
|---|---|---|---|
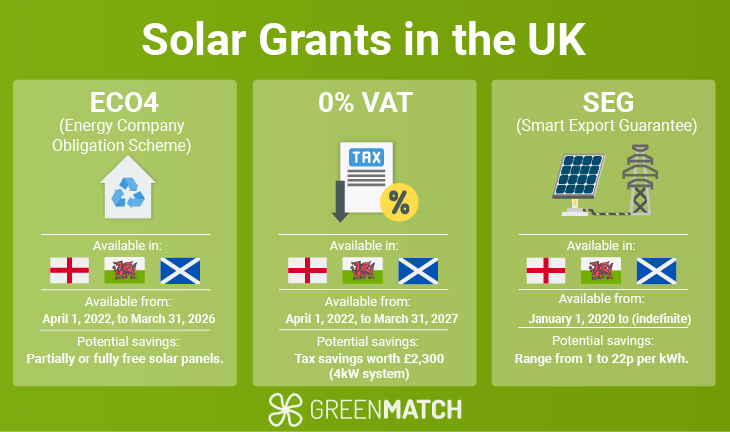
| 0% VAT | England, Scotland, Wales | April 1, 2022 – March 31, 2027 | Average savings of £2,850+ on installation & energy bills |
| Smart Export Guarantee (SEG) | England, Scotland, Wales | January 1, 2020 – (indefinite) | 1 – 30p per kWh |
| ECO4 (Energy Company Obligation Scheme) | England, Scotland, Wales | April 1, 2022 – March 31, 2026 | Partially or fully free solar panels |
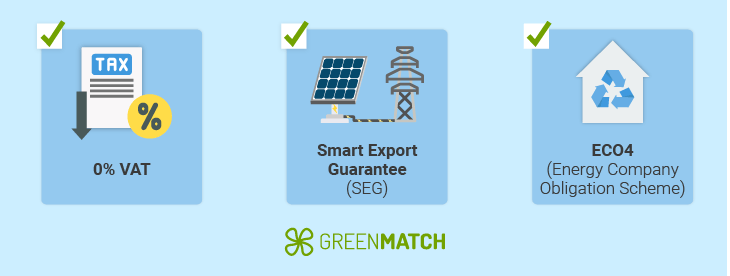
It’s important to consider that not all of the active grants and financial schemes are available across the entire UK. We’ve included the top 3 grants for you to consider. Most notably, the 0% VAT, ECO4, and the Smart Export Guarantee (SEG) all cover payments for solar panels and UK government subsidies for sustainable energy.
Solar panel funding is subject to the new VAT reduction on energy-saving products, which includes PV panels and solar batteries. Until March 2027, you’ll pay 0% on VAT, allowing the average household to potentially save £2,850 on taxes. This price decrease is automatically added, so there’s no need to do anything to apply for it.
Other grants allow for earnings, as mentioned earlier. As of January 1 2020, the Smart Export Guarantee effectively replaced the Feed-in Tariff (FIT). With the SEG, UK homeowners can earn money by exporting surplus energy back to the grid.
The SEG requires all energy suppliers with over 150,000 customers to offer a tariff for electricity sold to the grid. To benefit from this, you need a smart meter and a solar panel system of less than 5MW. Individual energy suppliers can set their own tariffs, but as of 2024, general export tariff rates are between £0.05 to £0.10/kWh. Based on an average tariff rate of £0.108/kWh, the average home's annual savings increases to £1,141, adding roughly £75 to your existing savings.
You can also consider the ECO4 Scheme if you’re eligible. With ECO4, households that receive certain low-income benefits can upgrade their domestic electricity supply with a more affordable and environmentally friendly option, such as solar PV panels in the UK. You can potentially earn entirely free solar panels but this is contingent upon an inspection of your home and which energy measures the inspector believes best suit it.
Benefits that qualify for ECO4 include:
- Income-based Jobseekers Allowance (JSA)
- Income Support (IS)
- Income-related Employment & Support Allowance (ESA)
- Credit Working Tax Credit (WTC)
- Pension Credit Savings Credit
- Pension Credit Guarantee
- Universal Credit (UC)
- Housing Benefit
- Child Tax Credits (CTC)
Part of the requirements is that you need to be receiving government benefits to qualify. If you’re not on benefits, you could also consider the ECO4 LA Flex, which has less strict requirements. Since this is based on an inspection, household solar panels may not necessarily be recommended, depending on your home.
It's also important to check for regional schemes. Solar panel grants in Scotland can be different from the rest of the UK, with schemes like the Warmer Homes Scotland scheme. This can allow for improvements to your home, potentially amounting to £10,000, which could include solar panels depending on a recommendation from an assessor.
Is your house suitable for solar panels?
Solar panels are suitable and fit for most homes in the UK, as evidenced by the installation of nearly 12,000 solar panels in the UK each month, according to national government statistics. However, to install solar panels, it’s essential to have enough roof space, adequate sunlight, and a structurally sound roof to support them (asphalt, metal, tile, tar, and gravel roofs are best for solar panels).
You can easily find out if solar panels are suitable for your home by using the checklist below.
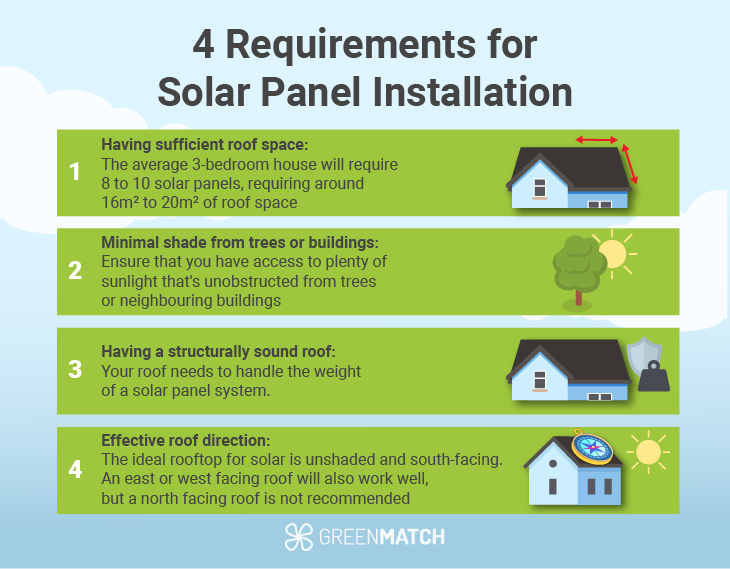
Let's take a closer look at these hard requirements:
- Having sufficient roof space: To install a 4kW system (best for 3-bedroom homes) of 400W solar panels, you’d need about 8 to 10 solar panels, requiring around 16 m2 to 20 m2 of roof space. For a 5kW solar panel system, you’d need 13 solar panels and 26 m2 of roof space on average.
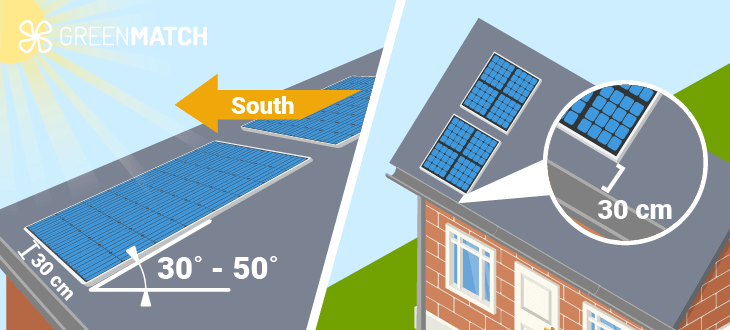
Aside from accounting for how much space the panels take, you need at least 30 cm of space between the panels and the edge of the roof as per MCS regulations. Opting for a smaller size or fewer panels than recommended may compromise electricity generation and the overall benefits for your home.
- Minimal shade from trees or buildings: Ensure you have access to plenty of sunlight unobstructed from trees or neighbouring buildings. Shaded or scattered panels will not operate at full capacity, affecting their overall efficiency. Cloud cover, however, is not a major concern as solar panels operate well even with clouds in the way.
-
Having a structurally sound roof: Your roof needs to handle the weight of a solar panel system, which usually ranges between 18 kg – 21 kg. Nowadays, most roofs are suitable for holding solar panels. Some older homes may require an assessment first, especially if they have metal (which can corrode) or asphalt shingles.
If your roof is old or showing signs of damage, such as cupping or lifting, then it may be time to replace or repair it before installing solar panels. The lifespan of your roof can span from 15 - 80+ years and will depend on the roofing material.
- Effective roof direction: The ideal rooftop for solar is unshaded and south-facing. An east or west-facing roof will also work well, but a north-facing roof is not recommended since it won’t provide optimal solar energy for homes in the UK.
As long as you own your home and don’t live in a conservation area, you do not need planning permission to install your first solar panel system. However, each new panel or set of panels that are added will require notifying the utility company after the first installation.
Trying to find the best solar panel installers in your area can take hours of unwanted hassle. Rather than doing it alone, let us connect you with up to 4 local installers for free!
Click the button below to start getting up to 4 free quotes with our 30-second form.
- Quotes from local engineers
- Payment by finance available
- Save up to £1,567 per year
Are solar panels efficient in the UK?
Most solar panels on domestic systems in the UK are around 15-25% efficient, although some types of solar panels for houses can reach efficiency levels above 25%. The most efficient type of solar panels are monocrystalline panels. These have efficiency ratings ranging from 20% to 25%.
The efficiency of solar panels refers to the amount of sunlight converted into electricity versus the amount reflected off the panels or lost as heat. Thus, only a certain portion of the solar spectrum can be converted into electricity. While the average efficiency rating of 20-26% may seem low, it’s the same as in the rest of the world.
It is worth noting that solar panel efficiency is likely to increase even more due to advances in technology, but the panels will never be 100% efficient.
In terms of seasonality, while solar panel efficiency is higher on sunny days, solar panels do not need direct sunlight to work, as they can also produce a considerable amount of electricity on cloudy days and during the winter season. Therefore, for most of the year, UK weather is ideal for the efficiency of a photovoltaic system.
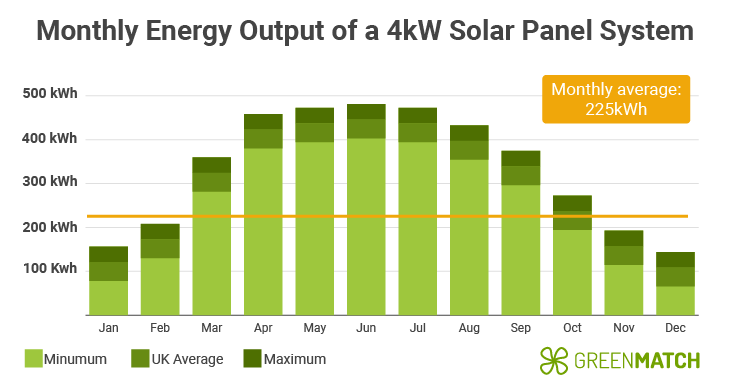
Solar panel efficiency per region
Each region in the UK has varying degrees of sunlight, so we have broken down the average monthly energy output per major city in distinguished regions to give you a better idea of potential energy output.
You can save varying amounts of money depending on the region you’re in. In London, for example, you can save an average of £175 – £420 on yearly electricity bills. In other areas like Stirling or Manchester, you can reduce your bills by £165 – £405 per year. These savings figures also depend on whether you use the Smart Export Guarantee and how much time you spend at home.
Take a look at the regional data below to see what the average output of a 4kW solar panel system is in your area.
Optimal solar panel angle and direction
You can ensure that your solar panels will function optimally by installing them in the right direction and angle. South-facing solar panels will have higher efficiency levels than those installed in another direction. As for pitch, the best angle for solar panels in the UK is between 30° and 40°.
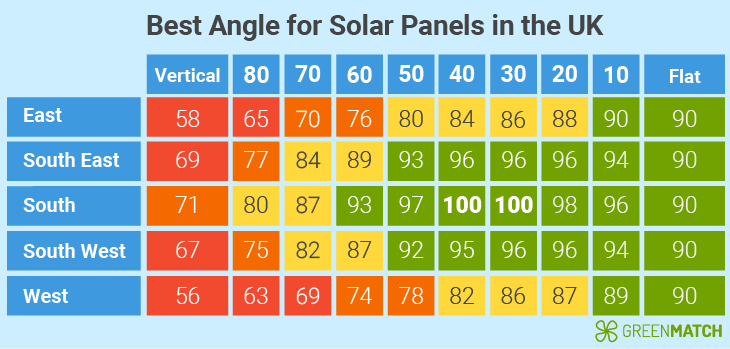
The power of solar panels is measured in kilowatt-hours (kWh). To find the average energy output, add the minimum figure and the average figure. To find the maximum output, add all three together.
How many solar panels do you need for your home?
A 2-3 bedroom home in the UK will require a 4-5kW system with 10-13 panels at 400W or 8-10 panels at 450W. Your average daily consumption and the number of sun hours in your area largely decide the number of solar panels you need.
| House size | Household energy consumption | Solar panel system size | Number of solar panels (350W) | Required roof space (350W) | Weight of system |
|---|---|---|---|---|---|
| 1-2 bedroom | 1,800kWh | 2 – 3kW | 5 – 8 | 10 - 16m2 | 9 - 13.5 kg |
| 2-3 bedrooms | 2,700kWh | 4 – 5kW | 10 – 13 | 20 - 26m2 | 18 - 22.5 kg |
| 4-5 bedrooms | 4,100kWh | 6kW | 16 | 32m2 | 27 kg |
These costs are estimates. Get a local installer QUOTE now!
The first step to finding out how many solar panels you need is to identify your current energy consumption, and it’s important to take the time to calculate this as accurately as possible.
How to calculate your solar needs:
- Check your electricity bills to get your power consumption (in kWh). You can either calculate month by month or add your monthly/quarterly consumption together for an annual figure.
- Decide on how much of your electricity bills you want to cover with your solar panel usage — this can be anything from 10-100%. Your decision will affect the system size and costs. For example, you may only want solar panels to charge your electric vehicle or some appliances rather than your whole home. This won’t need as big of a system.
- Calculate how many solar panels fit your roof. An average solar panel takes about 1.44m2 of roof space. Don’t forget to include at least 30 cm from the roof’s edge so there is enough space for the panels to have air pass through to prevent decreases in efficiency due to heating or (in the case of some arrays) overshadowing each other as the sun changes position. It also prevents the build-up of rainwater.
Is adding a solar battery a good idea?
Yes, adding a solar battery is highly recommended, even though it is not an absolute necessity. This can save over £1,400 per year by storing at cheaper energy rates for use during peak hours on top of solar savings. It is worth getting a solar battery with solar panels since they can:
- Help save on energy costs by storing energy for later use during peak hours and higher electricity rates.
- Allow for nighttime independent energy.
- They are absolutely crucial for off-grid solar since they will be your main source of energy without the electric grid.
Solar panel batteries in the UK can add an additional £5,000 to £9,500 to the cost, so many might be hesitant to get them. All in all, solar batteries are recommended, but solar panels work without them as well.
9 Practical questions every homeowner needs to answer before buying solar panels
Do I need to switch energy providers?
All energy providers cover solar power and have a tariff rate that they provide. If your main goal is to generate energy and sell it back to the grid, you should look for the most favourable SEG rates so you can earn more.
How will an installer access my roof for installation?
Solar panels can be attached to the roof by carrying them, or they can be carried by an elevator or a jetty. You need to make sure your roof is accessible for the installers and any other type of equipment they might need.
If I don’t buy a battery now, can I just plug it in later?
It’s worth noting that you can buy solar batteries later and add them to your system. However, this may require a change in your electric setup or inverters, and if purchased at the same time, you can get a bulk discount on installation expenses. If you wish to install one later, you should let the installer know beforehand so he can install panels that are best suited for a battery in the first place.
Can you have solar panels for your shed or garage?
Yes, but you need to consider the wiring attached to your home from the shed. This can increase the overall installation cost. Most sheds and garages do not have enough roof space to power a home, but they can power the appliances inside or allow for electric vehicle charging.
Do you need to upgrade your electrical system?
You need the appropriate size fuse rating and inverter size, which should be between 1.25 and 1.56 times the short-circuit current of the panels. In most cases, you do not need to change your fuse box. Older homes may need to expand to something more powerful.
The number of phases in your inverter needs to match the one in your electric connection. Single-phase connections require a single-phase solar inverter, but 3-phase connections can be attached in a variety of ways. Make sure you match your inverter to the type of phase you have.
Can the system be expanded later if my energy needs increase?
Yes. Expanding a system at any time is possible fairly easily, but you may need to get permission to install any installations after the first one.
How will the solar system connect to the grid, and will I need a new meter?
The solar panels should be connected directly to a power inverter, through which they can connect to your home grid. Alternatively, they may pass through a battery first, if you choose to install one.
It’s important to have a smart meter to go along with your solar panels. These can help decrease the cost of meter readings and eliminate the need for estimated bills by providing accurate read-outs. They also provide higher safety standards.
Will you need trenching or additional wiring for the installation?
Trenching can be necessary for many homes that lack the appropriate wiring infrastructure. In these cases, installing solar panels can cost a lot more money. It’s important to have your home assessed by an installer before you decide to install a solar panel because trenching can sometimes cost upwards of £10,000.
How much room do I need inside my house for the battery and/or inverter?
Most string inverters are less than 1m2 and quite small, while microinverters can fit in the palm of your hand. Batteries can vary in size, being anywhere from the same size as a thin suitcase to a tall fridge freezer unit. They can be wall-mounted or set on the floor. Many batteries can be quite heavy, so either placing them on the floor or strong wall-mounting is required. It’s worth noting that, for higher energy capacities, you may have to stack multiple batteries in series.
What does a solar panel installation look like?
The domestic solar panel installation process can take 1 to 2 days to complete with 2 installers. Labour costs for installing solar panels usually come between £600 – £1,000, typically requiring 2 installers. However, pre-installation steps like agreeing on a quote, manufacturing, and surveying your home can take several weeks.
The process can be summarised into a few key steps, as listed below.
- Preparation: Before installation can start, permits must first be acquired, and a rooftop survey is conducted to assess the available space and the roof conditions.
- Mounts are attached to the roof: Scaffolding will be built into your building a day before installation for easier access. Then the installer attaches mounts for the solar panels. If your home has tiles, they will be lifted so that the installers have access to rafters in the roof. Roof hooks are then inserted onto the rafters before the tiles are placed back, leaving the hooks protruding from the roof tiles.
- Solar panels are installed onto the mounts: Rails are then secured across the roof hooks so that the panels can lay onto them and be fitted.
- Solar panels are connected: Solar panels are either wired in series or parallel connections. A series connection is preferable for smaller systems that need more voltage, whereas parallel connections are suited to larger systems and those that face uneven sunlight. Keep in mind that series connections will stop working if there is a fault in any one of the panels, which is a serious downside.
- System circuit is connected: The panels need to then be connected to an inverter, which converts the DC current to usable AC current. The inverter then connects to your fuse box, which brings the connection to your home. If you have a solar battery, then it must also be connected to your inverter.
- Finishing touches: Your system will be tested, and you will be shown how everything works. Your installer will also register your system with the Microgeneration Certification Scheme. They will connect the app and teach you how to monitor your system.
How can you find the right solar panel supplier?
Solar panels can be expensive, and you want to be sure you find the right solar supplier for your home. You should compare different solar panel providers and pick a reliable and certified installer.
Here’s what you need to look out for when choosing a solar panel installer:
- Check what areas they serve: Make sure the installers you find serve your area. They often list this on their website. You can also call them or send an email.
- MCS certification: On a base level, you should make sure an installer has a Micro-generation Certification. Installers without this are less likely to have the correct expertise, and any non-MCS installation will prevent you from being able to earn back money in the form of SEG payments.
- Trustpilot scores: Research the companies by looking at their scores on various websites.
- Customer and professional reviews: Check customer feedback and professional reviewers to see what they offer in specific.
- Compare quotes from different installers: We recommend comparing at least 3 to 4 quotes to get a good idea of market prices.
Additionally, here’s what you need to look out for before accepting any quote:
- Check what panels they provide: There are many solar panels for sale in the UK, including Project Solar UK, REC, AIKO, Trina, and many more. Check which brands your chosen installer provides and research them thoroughly to find the best solar panels for your home.
- Request a planned layout: You can ask for an overview of how the solar panels will look on your roof, which will give you an idea of how it will look beforehand.
- Check warranties for all components: A standard solar panel warranty should definitely be 20 years or above. Warranties can vary for the inverter and for the solar battery, so make sure you know what you’re getting. Inverters should be guaranteed for 12 years, while batteries will vary based on the brand and model. Some battery warranties from UK companies last from 20 to 25 years, while others will be far less.
Solar PV installation is best conducted by installers that meet all of these criteria. It can be better to find local installers since they can provide a better rate.
However, finding the right solar panel supplier on your own means investing a lot of time in research. You could spend hours trying to find the best deal. We can simplify this process by providing you with up to four quotes from different suppliers in your area. This service is completely free and non-binding.
All you need to do is fill in a simple contact form, and we will then connect you with the most suitable installers near you. You can then compare these and get the best deal on solar panels!
- Quotes from local engineers
- Payment by finance available
- Save up to £1,567 per year
Frequently asked questions


We strive to connect our customers with the right product and supplier. Would you like to be part of GreenMatch?

- Solar Panels for UK Homes: A Complete Guide 2026
- What are solar panels and how do they work?
- Are solar panels worth the investment?
- Cost of solar panels based on household size
- Are there UK grants to reduce the costs of solar panels?
- Is your house suitable for solar panels?
- Are solar panels efficient in the UK?
- How many solar panels do you need for your home?
- Is adding a solar battery a good idea?
- 9 practical questions every homeowner needs to answer before buying solar panels
- What does a solar battery installation look like?
- How can you find the right solar panel supplier?
- Frequently asked questions
- Quotes from local engineers
- Payment by finance available
- Save up to £1,567 per year