Global Plastic Pollution Statistics and Facts

Plastic pollution has become one of our most pressing environmental issues. From overflowing landfills to vast ocean garbage patches, the impact of plastic waste is far-reaching and devastating.
This article explores key statistics and facts about global plastic pollution, its sources, and its effects on our planet.
Top Sources of Plastic Pollution
While plastic pollution comes from many sources, some are major contributors.
- Packaging is the largest end-use market segment, accounting for just over 40% of total plastic usage.
- Roughly 50% of plastic is used for single-use purposes – utilised for just a few moments but on the planet for at least several hundred years.
- More than 1 million plastic bottles are purchased every minute around the world.
The Scale of Global Plastic Pollution
Every year, we produce a staggering amount of plastic, with much of it ending up as environmental pollution. In 2019 alone, 368 million tonnes of plastic were produced globally. Unfortunately, much of this plastic becomes polluted, contaminating our land, waterways, and oceans.
1. An estimated 9.2 billion tons of plastic have been manufactured since the 1950s - 2017. Less than a quarter of it is still in use, with only 600 million tonnes known to have been recycled.
2. Every year, globally, we produce around 300 million tonnes of plastic waste. Around 40% of all plastic products are thrown away within a month. (Plastic Soup Foundation)
3. Plastic is mainly used for packaging, which 2017 accounted for 115 million metric tonnes. Building and construction are the second most used, accounting for only 64 million in the same year.
4. A study published in Science Advances (2017) calculated that we had produced 8,300 million metric tons of plastic to date, 25,000 times the weight of the Empire State Building.
5. Plastic use and consumption have driven global generation to approximately 300 million tonnes of plastic waste each year to keep up with demand, 60% of which ends up in our natural environment or landfills.
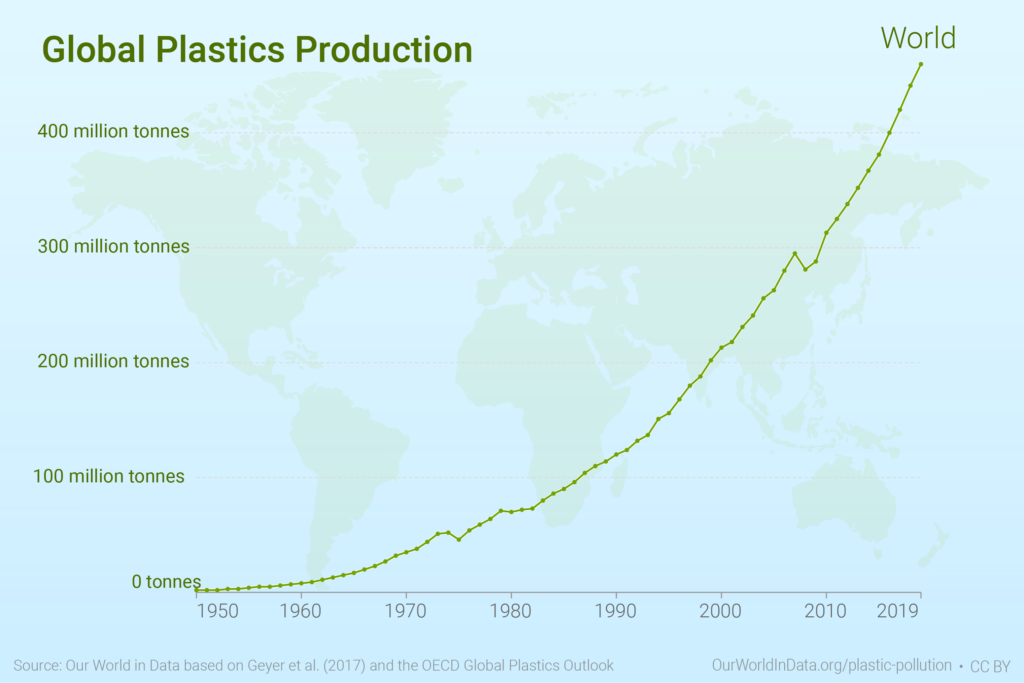
6. Global plastic production has risen quickly between 1950 - 2019. The graph below shows annual global plastic production measured in metric tonnes yearly.
7. As of 2021, there is more single-use plastic worldwide than ever - at an estimated 139 million tonnes.
8. The top 20 companies producing polymers for use in single-use plastic have remained unchanged since 2019. It appears that these companies are impervious to increasing climate anxieties.
9. The total greenhouse gas emissions from single-use plastics in 2021 equal those of the United Kingdom, the equivalent of 460 million tonnes of CO2. (Minderoo Foundation)
10. According to the Minderoo Foundation, the companies that contributed the most to single-use plastic generation in 2021 included ExxonMobil, Sinopec, DOW, and Indorama Ventures. These four companies cover the USA, China and Thailand.
11. China is widely regarded as the world's largest plastic producer, with a 32% share of all production.
12. Some companies are, however, attempting to make positive changes by producing recycled polymers at scale. Around ten major companies aim to ensure at least 20% of their production is made from recycled polymers by 2030.
13. The plastics sector still does not consider recycling efforts sufficient. Manufacturers produce single-use plastics from original materials 15 times more frequently than recycled stock.
Plastic Waste Generation
14. Approximately 400 million metric tonnes of plastic waste is produced yearly. Of this, 10 million tonnes will end up in the ocean.
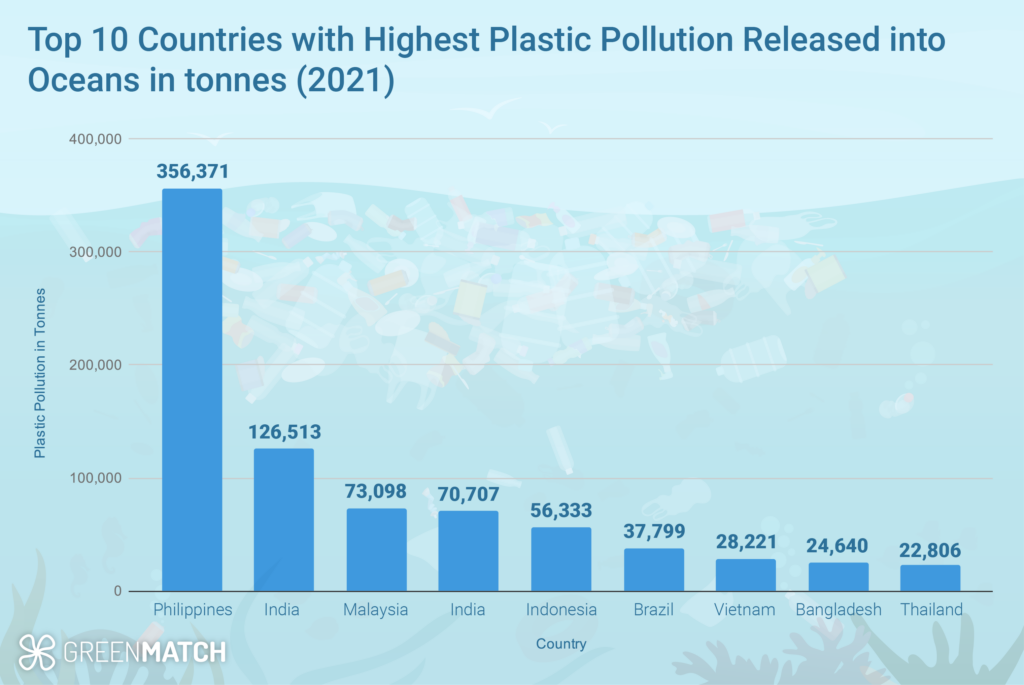
15. The world's most plastic-polluting countries include the USA (which produces 42 million metric tonnes of annual plastic waste); India is second with 26.3 million, and China follows with 21.6 million.
Some studies suggest, however, that China is the largest plastics polluter overall, but the USA is the worst per capita.
16. According to a 2021 US congressional report, the USA generates 130 kg of plastic waste (287 pounds) per person each year. Experts estimate that 1.13-2.24 million metric tons of that waste leak into oceans and the environment annually.
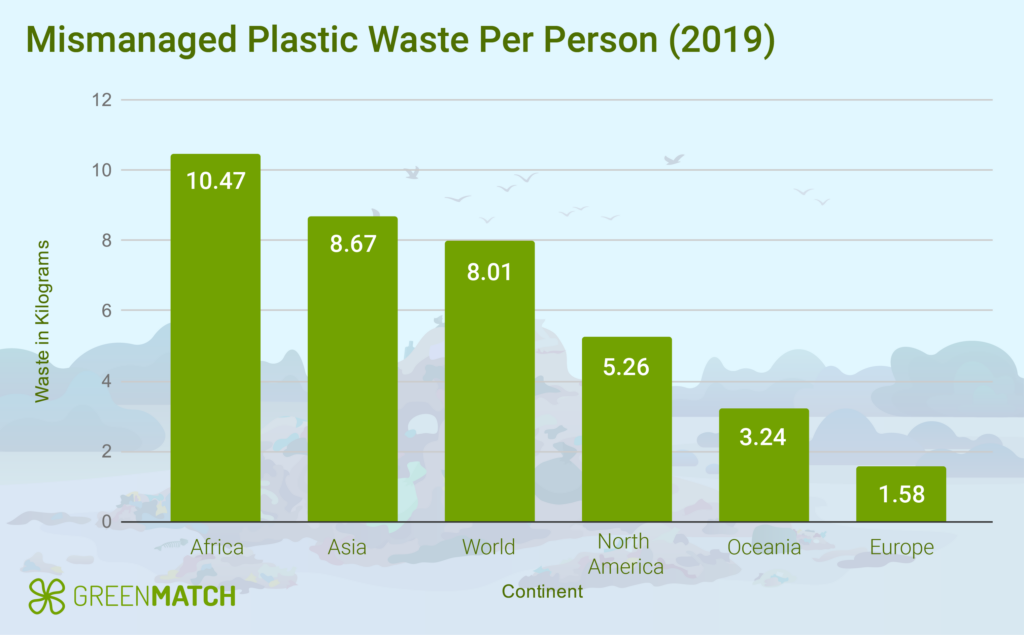
17. Across continents, in 2019, Africa had the most plastic waste per capita, at 10.47kg per person:
18. According to the Environmental Protection Agency (EPA), the United States generated 130kg of plastic waste per head of population in 2018. Landfills received approximately 146.1 million tonnes of municipal solid waste that year, with plastics accounting for over 18 per cent of the total.
19. Asia and Western Europe throw away the highest percentage of plastic in Municipal Solid Waste (trash or garbage). In both these regions, 12% of this was plastics, which often end up in landfills or the oceans.
Plastic Pollution in Oceans and Waterways
Our oceans bear the brunt of plastic pollution, which has devastating consequences for marine life and ecosystems. Experts estimate that 8 million pieces of plastic pollution enter our oceans daily. This pollution takes various forms, from large plastic debris to microplastics, which marine animals can ingest and introduce into the food chain.
20. Up to 46% of plastic waste comes from packaging. This includes bottles, bags, bubble wrap, pots and shrink wrap.
21. An audit of global brands undertaken by Break Free From Plastic discovered that the biggest plastic-polluting companies include Coca-Cola, PepsiCo, Nestle, Unilever and MondelezInternational. The top plastic polluting companies have consistently produced the most commonly found waste items over the past five years (2018 - 2022).
22. In 2021, the International Coastal Cleanup (ICC) community hosted coastline litter picks across the globe. Analysis of the waste items they collected revealed the most common waste items to wash up from the oceans. They included:
- Food Wrappers = 1,341,463
- Cigarette Butts = 1,134,292
- Plastic Drink Bottles = 849, 321
The list included bottle caps, plastic bags, glass bottles, cans, straws, and plastic cups or plates.
23.
24. Close to 40% of the ocean’s surface is thought to be covered by plastic waste and debris. Scientists warn that if plastic waste grows, there could be more plastic than fish in the oceans by 2050.
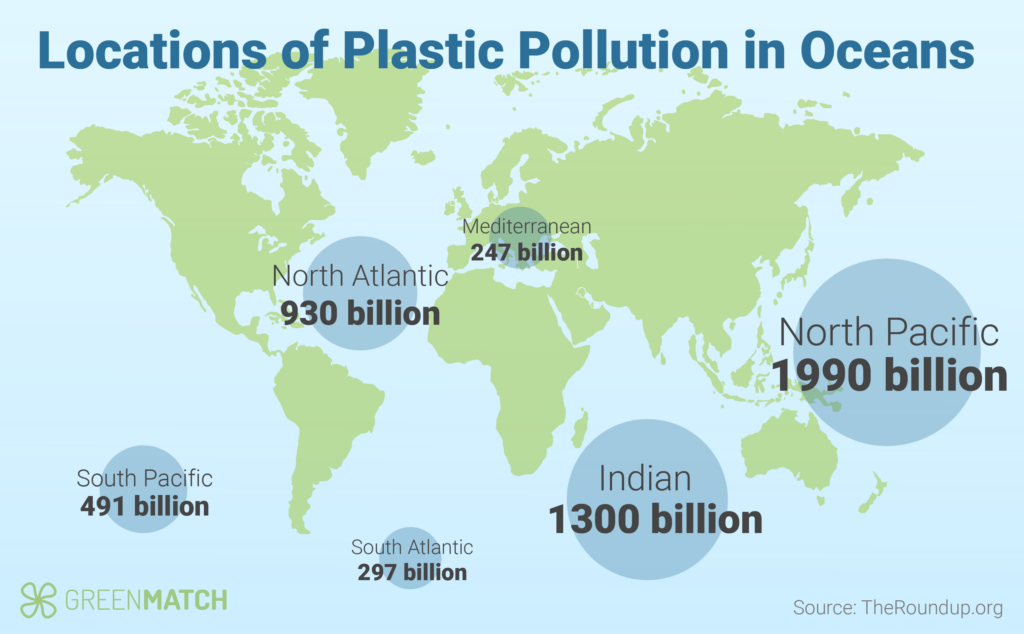
25. In the North Pacific Ocean, there is an area known as the ‘Great Pacific Garbage Patch’, which is thought to be made up of nearly two trillion pieces of plastic waste. It is estimated to be four times the size of Germany.
Much of the large debris in this area is made up of abandoned or lost fishing nets and other equipment.
26. Experts estimate that 1.3 trillion pieces of plastic pollute the Indian Ocean, 930 billion contaminate the North Atlantic, and another 491 billion litter the South Pacific.
(World Economic Forum)
27.
28. Since 2019, manufacturers have scaled up production of single-use face masks, plastic bottles of disinfectant, and other protective equipment to combat COVID-19. This plastic increase has created 8.4 million tonnes of plastic waste across 193 countries. Research suggests that 25,900 tonnes of that waste has leaked into the ocean.
29. Fishing litter, or ghost fishing equipment, contributes to up to 1 million tonnes of debris entering the ocean. Experts estimated that 100,000 marine animals die as a direct cause of this debris due to entanglement.
Impacts of Plastic Pollution
30. Research from 2020 concluded that by 2030, 53 million tonnes of plastic could end up in oceans, rivers and lakes yearly - unless mitigation measures were to increase dramatically.
31. Studies by Orb Media found that plastic fibres were present in 83% of tap water samples worldwide. It also revealed that residents in the USA and Lebanon were more likely to find plastic in tap water, with 94% of samples testing positive in those countries. It was also found that India had 82% contamination, and Europe had 72%.
32. India has the best plastic recycling rate in the world, recycling as much as 60% of its plastic waste. Second to this are South Africa, the Netherlands, South Korea, Norway, and Spain.
The global average plastic recycling rate is just 18%.
33. Americans generated 35.7 million tons of plastic in the United States in 2018. Some 12.2% of that makes up the total municipal solid waste generated - according to the Environmental Protection Agency (EPA).
34. Only 8.7% of all plastic waste was recycled in 2018 in the US. One cause of this could be that many recycling programs won’t accept every type of plastic. People often assume that recycling facilities process plastic bottles more frequently than any other type of packaging.
35. A report published in 2020 predicted that plastic pollution could grow to 29 million metric tons per year if we take no action. However, with increased recycled plastic production and waste collection systems, scientists can reduce that figure by 80%.
Solutions to Combat Plastic Pollution
Addressing plastic pollution requires action at all levels, from individual choices to global policies. Some key solutions include:
- We should reduce single-use plastic consumption and opt for reusable alternatives.
- Improving waste management and recycling infrastructure
- Developing and adopting biodegradable alternatives
- Supporting policies that limit plastic production and promote circular economy principles
The Path Forward
The plastic pollution crisis is a daunting challenge, but we can make a significant impact. Understanding the scale of the problem is the first step in combating plastic pollution. We can all act by reducing our plastic use and supporting eco-friendly businesses.
Additionally, advocating for stronger environmental policies is crucial in protecting our planet for future generations. With increased recycled plastic production and improved waste collection systems, scientists believe we can reduce plastic pollution by up to 80%.
We strive to connect our customers with the right product and supplier. Would you like to be part of GreenMatch?
