Countries With The Highest Carbon Footprint 2026

Carbon footprint emissions have skyrocketed to unprecedented levels since 2022, marking a staggering milestone of 37.1536.8 billion tonnes. In 2023, projections indicate that emissions surged by 1.1 per cent, culminating in an unprecedented peak of 37.55 gigatons of CO2, marking a new record in global emission levels.
In the face of this alarming figure, we must understand why and how these high emissions are produced.
By examining the countries with the highest carbon footprint, we can get a more focused understanding of carbon emissions and examine how we can change and reduce the impact of these harmful emissions.
This article will focus on the most recent figures to uncover the top 10 countries with the highest carbon emissions. Through our analysis, we’ll shed light on the leading causes, from using fossil fuels like coal, gas and oil to significant industrialisation and population increase.
We’ll also look closely at what these countries are doing to take action, whether through ‘net zero’ policies or other government commitments. We’ll explore what drives the emissions crisis and what changes are needed to combat it.
Top 10 highest carbon emitting countries
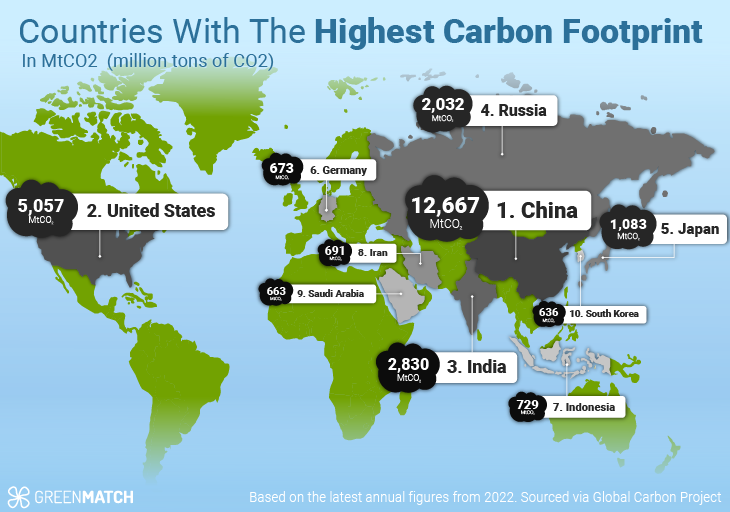
The top 10 countries in terms of MtCO 2 emissions (in million tons of CO2) for 2021 are listed below:
| Rank | Country | MtCO2 (million tons of CO2) | Percentage of World CO2 Emission |
|---|---|---|---|
| 1 | China | 12,667 | 32.88% |
| 2 | United States of America | 5,057 | 12.6% |
| 3 | India | 2,830 | 6.99% |
| 4 | Russia | 2,032 | 4.96% |
| 5 | Japan | 1,083 | 2.81% |
| 6 | Indonesia | 729 | 1.8% |
| 8 | Iran | 691 | 1.78% |
| 7 | Germany | 673 | 1.75% |
| 9 | Saudi Arabia | 663 | 1.66% |
| 10 | South Korea | 636 | 1.53% |
Key considerations
Before analysing these countries, we wanted to acknowledge some crucial global events that may have impacted these numbers.
Firstly, we recognise that this data is the latest as of 2022. This year, the world was still mainly recovering from the COVID-19 pandemic. Whilst some countries may have started to rebuild by this point, emissions figures captured are likely to have been affected by the shutdown of businesses, transport and industries.
Secondly, we also acknowledge that the peak of the energy crisis began in 2021-2022. Multiple factors caused this - including the impact of the pandemic and pre-war movements by Russia before it invaded Ukraine in February 2022. The energy crisis saw more countries using alternative fuels, mostly opting for coal instead of gas, as it became less widely available and more expensive. Coal, however, has a much higher carbon footprint level, which will have increased record outputs beyond everyday use.
Despite these global events impacting everyday life, we can still gain valuable insight from this data set. It helps us identify, even during extreme challenges, just how much carbon dioxide is still being produced. We’ll look at each country in detail in our analysis.
Analysis of each country's carbon footprint 2026
To understand what drives certain countries to the top of this list, we’ve analysed the leading causes of emissions for each of those in the top 5. Through this research, we hope to discover common causes and unique points.
According to data from the World Population Review and the Global Carbon Project, China, the United States, and India top the list of countries with the highest CO2 emissions in 2021 and are still leading as of 2022. This isn't surprising given their large populations and industrial activities. However, the list significantly changes when examining CO2 emissions per capita. This data reflects populous nations' ongoing challenges in managing their environmental impact.
However, the situation appears even more daunting when considering emissions per capita, where smaller nations like Palau and Qatar record disproportionately high figures due to their smaller populations but extensive use of fossil fuels in industries and energy production.
By looking at each country's challenges, we can better understand global emissions, the main cause of climate change. Being better aware of what needs to change can help us adapt and reduce our impact on the planet.
Carbon Footprint Top Five Countries
The countries with the highest carbon emissions predominantly have large populations and extensive industrial activities. China, with its population of over 1.4 billion people, tops the list, followed by the United States, India, Russia, and Japan.
However, total emissions alone don't tell the full story. It's also essential to consider per capita emissions, which provide a more accurate measure of a country's carbon footprint relative to its population size.
1. China Emissions: 12,667.43 million tons of CO2

It might not be surprising that we find China at the top of this list, with its incredible population of over 1.4 billion people. This means tremendous demand for energy-dependent industries.
Despite efforts to expand renewable energy sources, China's industry and exports heavily rely on coal and other fossil fuels, which are key to the nation’s high carbon dioxide output. This dependence on fossil fuels is one of the main contributors to the country’s high carbon footprint emission levels.
China’s economy and industry have also rapidly expanded in recent years. Major infrastructure projects have increased the need to produce cement and steel, significantly increasing CO2. Half of the world’s steel is produced in China.
According to a report of global CO2 emissions in 2021, electricity and heating were the biggest cause of emissions. Between 2019 and 2021, China was responsible for almost all of those.
2. United States of America Emissions: 5,0507.00 million tons of CO2

With the third largest population in the world, America is home to almost 333 million people. This is also a huge factor in its emissions levels, as more people create a need for energy and fuel consumption.
However, it’s interesting that India has the second largest population on earth, yet America still produces more carbon footprint. There are a few main reasons for this.
While the U.S. has seen a slight increase in emissions due to advancements in renewable energy and energy efficiency, the transportation and industrial sectors remain substantial contributors.
We know that most countries' emissions come from burning fossil fuels. In the US, emissions are mainly derived from producing electricity and heating by burning coal, oil, and gas. Transportation is also significant for them, including cars, shipping trucks, aviation, and public transport.
Another aspect to account for is fluctuating weather patterns in America, which cause higher demand for heating and cooling systems. Whilst it is possible to adopt renewable energy technology for these needs - such as heat pumps or solar panels - it’s estimated that around 48% of homes in the US still use natural gas for this, contributing mainly to the country's overall emissions figures. Given the increase in severe weather conditions, such as heat waves or blizzards, the use of home temperature technology will only increase.
3. India Emissions: 2,709,683,700.00 tons of CO2

For our third country on the list, the cause of emissions is slightly different. In India, the largest source of carbon emissions comes from power plants and agriculture.
Power plants in India are coal-fired, emitting vast volumes of carbon dioxide as they generate energy. The carbon intensity of coal is one of the highest among fuel sources, resulting in twice the amount of CO2 produced when burning coal compared to gas for the same amount of energy. Because of this, coal has been identified as one of the least sustainable energy sources for the environment.
Agriculture is India's second-largest source of emissions, as rice, paddies, and cattle create large amounts of methane. Methane is classified as a greenhouse gas (GHG), a collection of gases directly responsible for global warming. Increases in the use of artificial fertilisers and burning crops, however, have also increased the amount of emissions from the country.
4. Russia Emissions: 2,0321.04 million tons of CO2

In Russia, the causes of carbon emissions are comparable to those of others on the list. Most of their emissions come from burning fossil fuels during energy production and manufacturing materials such as cement.
It is worth noting that Russia has a vast population of over 146 million people. With the additional fact that Russia is the largest exporter of oil and gas, it is understandable that the country would have high emission rates if the majority of homes, businesses, production and transportation were all running on fossil fuels.
This is mainly due to the country's vast oil and gas industries being its primary emissions sources.
5. Japan Emissions: 1,083.65 million tons of CO2

The energy and production industries are responsible for Japan’s largest carbon output. The generation of electricity and the intensive manufacture of materials are the main contributors to the nation’s emissions.
Burning fossil fuels to produce energy, much like in the other top countries, contributes to their high carbon dioxide volumes. However, within Japanese cities, gasoline, kerosene, and LPG (Liquefied Petroleum Gas) are also used as fuel sources, which contribute to the figures.
CO2 Emissions Per Capita
When examining CO2 emissions per capita, the scenario shifts dramatically. Smaller countries with high levels of economic development or specific industrial activities tend to have higher emissions per capita.
For instance, Palau tops the list with 59.00 tonnes per capita, followed by Qatar at 35.52 tonnes and Kuwait at 24.90 tonnes. This data highlights the disproportionate impact of smaller economies with intensive energy use in oil extraction and refining industries.
Countries with intensive industrial sectors or high reliance on fossil fuels for energy production tend to have higher per capita emissions.
Top 10 Countries CO2 Emissions Per Capita 2026
Here's a quick rundown of the top 10 countries with the highest CO₂ emissions per capita as of 2024:
- Palau: With 59.00 tonnes of CO₂ per person, Palau tops the list. This high number is mainly due to the country's reliance on diesel-fired power stations and transportation between its many islands.
- Qatar: At 35.52 tonnes per person, Qatar's emissions are driven by its significant oil and gas industry.
- Kuwait: Emitting 24.90 tonnes per person, Kuwait's carbon footprint is also fueled by its oil-rich economy.
- United Arab Emirates: With 21.75 tonnes per person, the UAE's carbon footprint reflects its status as a global business hub and oil exporter.
- Bahrain: Bahrain's emissions are 21.31 tonnes per person, closely linked to its industrial sector.
| Rank | Country | CO₂ Emissions per Capita (tonnes) |
|---|---|---|
| 1 | Palau | 59.00 |
| 2 | Qatar | 35.52 |
| 3 | Kuwait | 24.90 |
| 4 | United Arab Emirates | 21.75 |
| 5 | Bahrain | 21.31 |
| 6 | Trinidad and Tobago | 21.17 |
| 7 | Brunei | 20.65 |
| 8 | Gibraltar | 18.96 |
| 9 | New Caledonia | 18.24 |
| 10 | Oman | 17.09 |
While total emissions are essential, per capita data provides insight into a country's environmental policies. For example, the US ranks 13th for per capita emissions at 13.68 metric tons, while China is 28th at 8.20 metric tons despite having the highest total emissions globally.
A Comparison of the Top Ten Countries
The energy sector, particularly electricity and heat production, was identified as the most significant contributor to global emissions, which aligns with historical data pointing to a 76% contribution to overall greenhouse gas outputs.
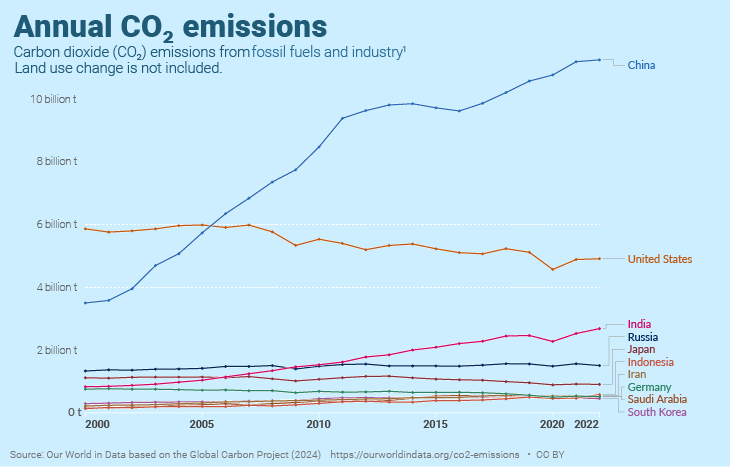
The chart below offers valuable insight into the rise and fall of carbon emissions across the top 10 countries between 2000 - 2022. It’s interesting to note that countries such as China and India have been on an increased trajectory since the turn of the millennium. However, despite still sitting at number 2 on the list, the USA has seen a small increase or steady decline since 2010.
There is also an indication here that during the first year of the COVID-19 pandemic, 2019-2020, nearly every country experienced some decrease in emissions. This is likely to have been caused by the global lockdown when people stopped travelling, businesses closed, and less fuel was being burned globally.
This chart also gives us a great overview of each country's progression since 2000, and the staggering rise of China’s emissions shows us just how rapidly the country has developed in the last 20 years.
Plans and pledges
Across the globe, governments and leaders are taking steps to ensure action is taken to reduce emissions and the effects of climate change. Of the top 5 countries with the highest carbon footprint, we've outlined how each country has shown commitment to reversing or implementing changes to reduce their impact on the planet.
Here are some of the countries' main climate goals:
China
- Aim to achieve carbon neutrality before 2060.
- Commitment to raise the share of non-fossil fuels in its energy consumption to 25% by 2030 and increase wind and solar power capacity.
- They will no longer build coal-fired power stations overseas.
The United States
- 'The Climate Pledge' commits to reaching net-zero carbon emissions by 2040 through the combined efforts of the world's largest companies.
- The United States rejoined the Paris Agreement under President Biden's administration and pledged to reduce greenhouse gas emissions by 50-52% below 2005 levels by 2030.
India
- Committed to reducing emission levels of its economy by 45% and achieving around 50% of electric power capacity from non-fossil fuel-based resources by 2030.
- Approximately 33 states and territories in India have announced state-level climate change plans.
Russia
- Between 2015 and 2020, Russia made differing commitments to cut greenhouse gas levels by 70% by 2030, and then later, this was changed to 30%.
- Russia's pledges towards climate change are difficult to determine and have been criticised for being inadequate and unambitious. Despite being one of the world's largest emitters, existing policies indicate no real commitment to curb emissions.
Japan
- Aim to reach carbon neutrality by 2050 and reduce greenhouse gas emissions by 46% by 2030.
- Develop new technologies by 2050 that contribute to reducing CO2 globally to 'beyond zero'.
- Over 400 local governments have committed to net-zero emissions by 2050. These represent the majority of Japan's population.
Strategies for Reduction
Understanding the carbon footprints of different countries helps recognise the challenges and responsibilities each faces in the fight against climate change. By focusing on the top emitters, we can identify where significant changes are necessary to make a global impact.
This analysis informs and encourages action towards a more sustainable future with renewable energy sources.
To address these high carbon emissions, countries are adopting various strategies:
- Renewable Energy Investments: Many of these top emitters are increasing their investments in renewable energy sources like solar panels to lower cost and wind energy.
- Emission Reduction Policies: Nations are implementing stricter emission regulations and setting ambitious goals to cut carbon outputs in the coming decades.
- International Cooperation: Global agreements and cooperation ensure that countries commit to and reach their emission reduction targets.
Common themes and conclusions
Some nations are taking various steps to combat carbon emissions, from setting net-zero goals to implementing green initiatives. These efforts aim to reduce fossil fuel dependency and encourage more sustainable practices among individuals and industries.
When analysing the countries with the highest carbon footprints, it’s clear that there are many common challenges and similar sources of carbon emissions globally.
The cause of these problems is burning coal, oil, and gas for energy generation and industrial purposes. Most nations heavily depend on coal to provide energy; this fuel is among the worst for producing carbon emissions.
Transportation, agriculture, industrial activities and manufacturing also push those carbon figures to an all-time high. In addition, high population growth and heating and cooling systems in homes create even greater emissions, as most also run on fossil fuels.
Despite the discouraging conclusions, some optimism can be taken from states’ and global authorities’ promises and agreements. Lowering carbon discharges and boosting sustainable energy sources is the initial step.
Although these findings look bleak, there is some hope in the pledges and commitments governments and world leaders are making. Reducing carbon footprint and increasing renewable energy sources are the first steps.
To make the necessary progress towards a more sustainable future, we must develop new technologies and assist people and businesses to transition to them. Grasping the origin of detrimental emissions is critical to formulating new plans to confront climate change. By embracing fresh, sustainable approaches, all of us can do our part in creating a brighter, more optimistic outlook for our planet.
Technology has revolutionised the way we communicate. Through the use of digital devices, people can interact with each other quickly and easily from afar. This has drastically changed the way individuals communicate, enabling them to interact with one another more efficiently than ever before.
Understanding the sources of harmful emissions is the key to forming new strategies to combat climate change. By adopting new, sustainable practices, we can all contribute to a greener, more promising future for our planet.


We strive to connect our customers with the right product and supplier. Would you like to be part of GreenMatch?
